18 November 2022: Original Paper
Altered Serum Bile Acid Profile Associated with Chronic Allograft Dysfunction in Kidney Transplant Recipients
Yamei Li 1ACDE , Hua Zhang 23CFG , Xinhua Dai 1BC , Yunfei An 1BD , Yi Li 1AD , Lin Yan 1EF , Yunying Shi 4EF , Jiwen Fan 1BC , Xingxin Gong 1BDF , Lei Zhang 1D , Yuangao Zou 1F , Lanlan Wang 1AG , Yangjuan Bai 1ADE*DOI: 10.12659/AOT.937974
Ann Transplant 2022; 27:e937974

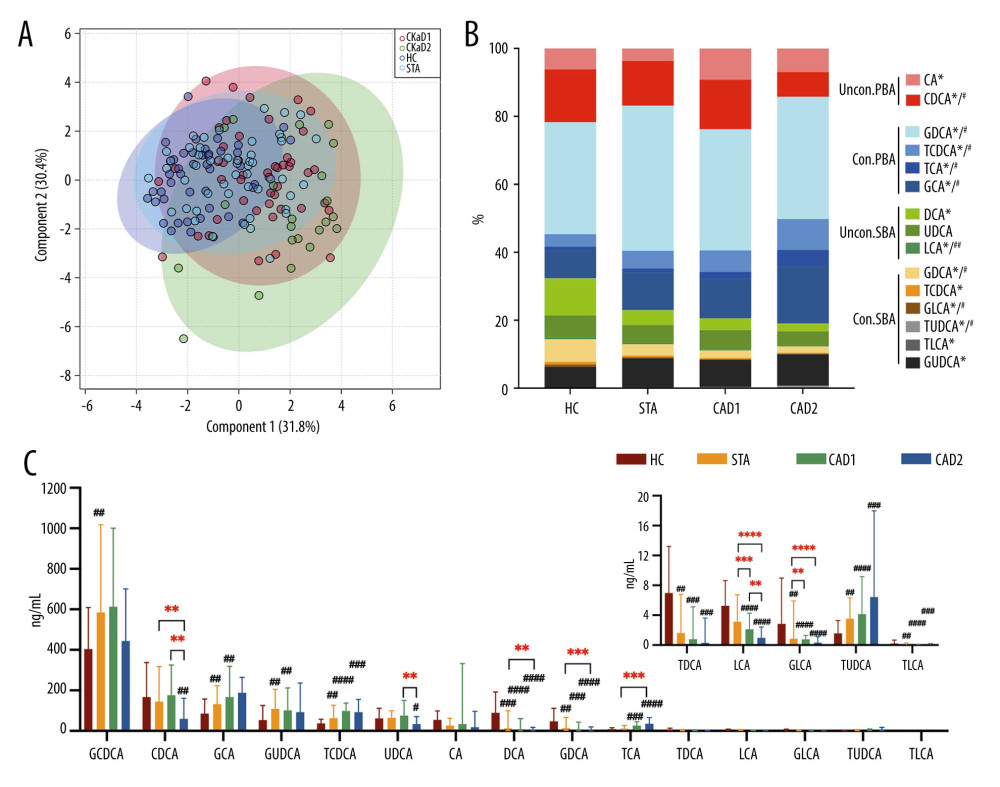
Figure 1 Comparison of BA profiling, composition, and absolute concentrations of individual BAs among HC, STA, CAD1, and CAD2 groups. (A) Supervised partial least squares-discriminant (PLS-DA) score plot based on 15 BAs. (B) Differences in the composition of BAs in 4 groups. * P<0.05 for the comparison among 4 groups. # P<0.05 for the comparison among the 3 KTR groups. (C) Serum concentrations of individual BAs in 4 groups. ## P<0.008, ### P<0.001, #### P<0.0001 vs HC group. ** P<0.008, *** P<0.001, ***** P<0.0001. Figure 1A was generated in MetaboAnalyst (version 5.0, https://www.metaboanalyst.ca). Figure 1B and 1C were generated using GraphPad Prism (Version 9.0.1, GraphPad, La Jolla).


