18 November 2022 : Original article
Altered Serum Bile Acid Profile Associated with Chronic Allograft Dysfunction in Kidney Transplant Recipients
Yamei Li1ACDE, Hua Zhang23CFG, Xinhua Dai1BC, Yunfei AnDOI: 10.12659/AOT.937974
Ann Transplant 2022; 27:e937974


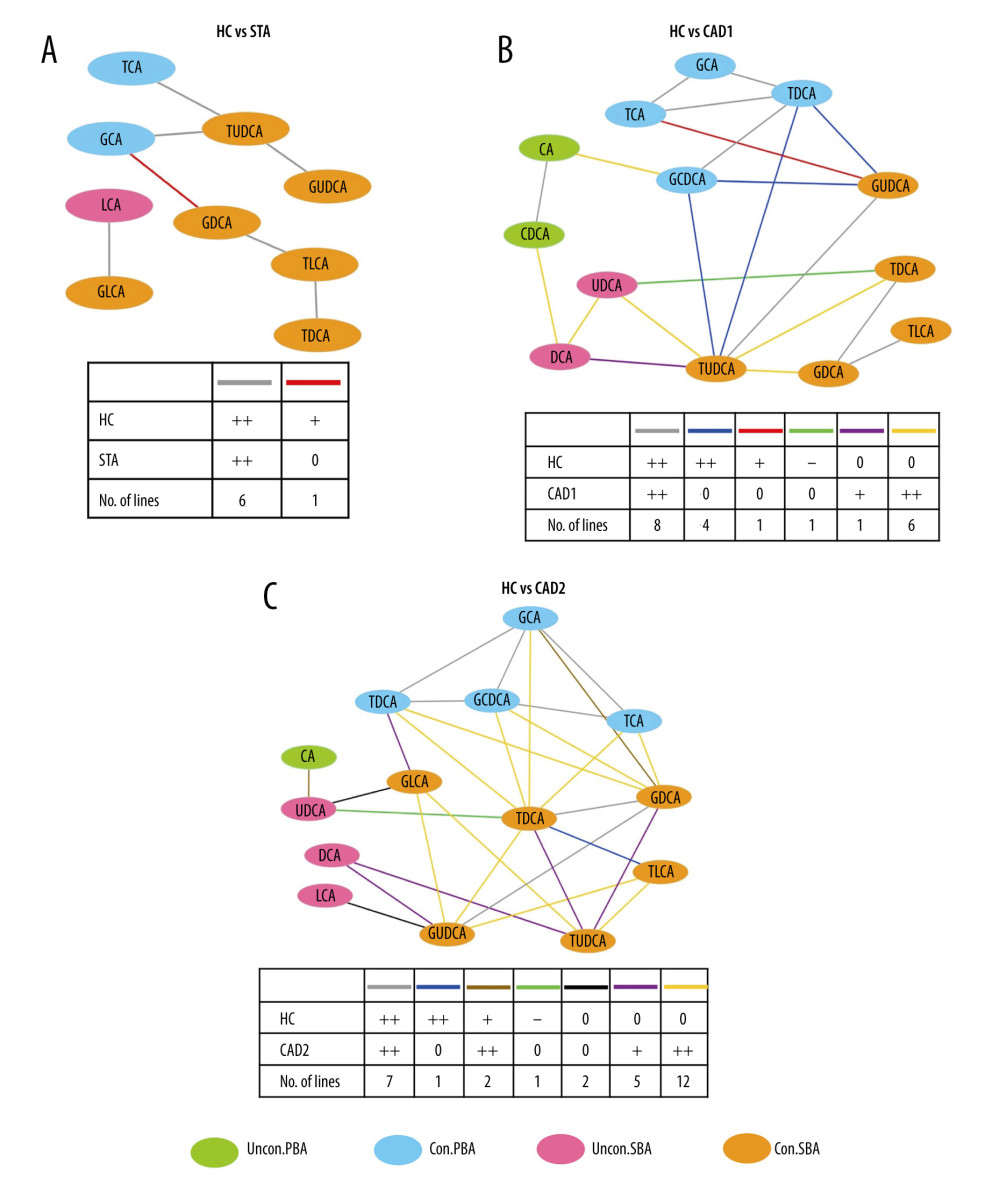
Figure 3 Differential correlation analyses of various BAs between HC and KTR groups. Network analysis illustrates the differential correlation of BAs between study groups (A–C). Only BA pairs with significant differential correlations (P<0.05) were included. The colored lines connecting BAs indicates the direction and strength of the correlation groups, and the number of lines that follows indicates the number of BA pairs in the global networks exhibiting this pattern of change. For instance, the red line +/0 1 in Figure 3A indicates that the correlation between GCA and GDCA was positive (+) in the HC group, but the correlation disappeared (0) in the STA group. Only 1 BA pair connected by red line in the network displayed this pattern of change (+/0). +P<0.05, ++P<0.01, are positively correlated; −P<0.05, is negatively correlated; 0, represents unrelated. Differential correlation coefficients between BA pairs were calculated with the “DGCA” package and the visualization of correlation networks were achieved using Cytoscape software (Version 3.7.2).