18 November 2022 : Original article
Altered Serum Bile Acid Profile Associated with Chronic Allograft Dysfunction in Kidney Transplant Recipients
Yamei Li1ACDE, Hua Zhang23CFG, Xinhua Dai1BC, Yunfei AnDOI: 10.12659/AOT.937974
Ann Transplant 2022; 27:e937974


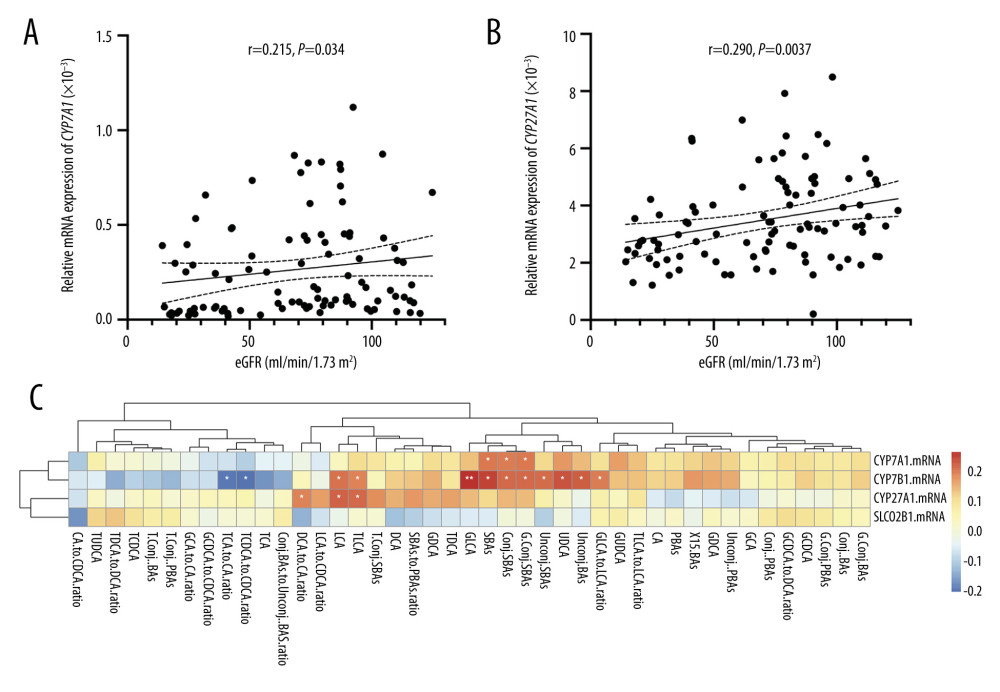
Figure 6 Correlation between relative gene expression of CYP7B1 and CYP27A1 and eGFR levels (A, B). The correlation matrix displays the Spearman correlations between gene expression and BAs species (C). Figure 6A and 6B were generated by using GraphPad Prism (Version 9.0.1, GraphPad, La Jolla). Figure 6C was generated by using R (version 4.2.0, https://cran.r-project.org) and the “corrplot” package was used.