22 January 2021: Original Paper
Effect of Everolimus with Low-Dose Tacrolimus on Development of New-Onset Diabetes After Transplantation and Allograft Function in Kidney Transplantation: A Multicenter, Open-Label, Randomized Trial
Hyung Duk Kim1BEF, Ji-Yeun Chang1CDE, Byung Ha Chung1AB, Chan-Duck Kim2B, Sang-Ho Lee3B, Yeong Hoon Kim4B, Chul Woo Yang1ADG*DOI: 10.12659/AOT.927984
Ann Transplant 2021; 26:e927984
Abstract
BACKGROUND: This randomized controlled trial aimed to investigate the effect of everolimus (EVL) with low-dose tacrolimus (Tac) on the development of post-transplantation diabetes mellitus (PTDM) in kidney transplantation (KT).
MATERIAL AND METHODS: Seventy-seven kidney transplant patients from 4 transplant centers were included. Patients were randomized to the “EVL group” (n=38) and the “TAC group” (n=39). The target Tac trough level was 2 to 5 ng/mL in the EVL group and 5 to 10 ng/mL in the TAC group.
RESULTS: The 1-year cumulative incidence of PTDM in all patients was 7.8%, and no difference was found between the 2 groups (P=0.0819). Insulin resistance measured with the homeostatic model assessment for insulin resistance showed a significant increase only in the TAC group (1.11 to 1.30, P=0.0492). Allograft rejection rate and estimated glomerular filtration rate (eGFR) follow-ups every 3 months were not significantly different between the 2 groups. However, the EVL group showed a significant increase in the mean eGFR at 9 months and 12 months after KT compared to the baseline value (P=0.0242 and 0.0491, respectively). The EVL group showed lower insulin resistance and higher allograft function in comparison to the TAC group.
CONCLUSIONS: EVL-based immunosuppressive therapy with lower Tac exposure could be a safer alternative for maintenance treatment.
Keywords: Diabetes Mellitus, Graft Rejection, Kidney Transplantation, Allografts, Everolimus, Glomerular Filtration Rate, Immunosuppressive Agents, Tacrolimus
Background
Current immune suppression for kidney transplant (KT) recipients consists of tacrolimus (Tac), mycophenolic acid (MPA), and steroids. The introduction of a Tac-based triple therapy in the last 2 decades has significantly reduced the incidence of early acute rejection, and has increased the 1-year allograft survival [1,2]. Tac reduced the incidence of acute rejection by 17.2% compared to cyclosporine A (CsA), and the current 1-year graft survival rate after transplantation exceeds 90% [3,4].
However, Tac is known to destroy insulin-secreting beta cells, resulting in post-transplantation diabetes mellitus (PTDM). PTDM refers to diabetes diagnosed after organ transplantation. The diagnostic criteria follow the type 2 diabetes mellitus (DM) guideline presented by the American Diabetes Association (ADA) and the World Health Organization (WHO). However, it is not appropriate to diagnose PTDM with only HbA1c due to the characteristics of KT recipients, who often have impaired renal function [5]. Risk factors for PTDM development include a family history of DM, old age, obesity, and a history of impaired fasting glucose before transplantation [5].
PTDM is one of the major risk factors for patient mortality and graft loss in KT recipients [6]. After transplantation, patients with PTDM have been reported to have a 1.63-fold higher risk of graft failure and a 1.87 times higher risk of mortality [7]. PTDM is a major risk factor for cardiovascular complications [8]. In a Norwegian study of 201 KT recipients followed for 8 years, PTDM was identified as an independent predictor of major cardiac events, and increased the risk by 3.6-fold [8]. It is also well known that the incidence of PTDM is associated with reduced allograft survival [9], more infectious complications [6], and increased medical costs [10].
The prevalence of PTDM varies due to the use of inconsistent diagnostic criteria, but is known to be approximately 10–15% in the first year after KT [11]. The prevalence of PTDM is nearly 20% in KT recipients treated with Tac, which peaks around 6 months after KT [2,12,13]. Tac increases the risk of PTDM and impaired fasting glucose at 6 months after KT compared to CsA (PTDM 17%
Several immunosuppressants have been expected to reduce the diabetogenic nature of Tac, including mammalian target of rapamycin (mTOR) inhibitors such as sirolimus and everolimus (EVL) [15–17]. In a large-scale study conducted using data from the United States Renal Data System [18], sirolimus was identified as an independent risk factor for PTDM. About 36% more PTDM occurred in patients treated with sirolimus and antimetabolite such as mycophenolate mofetil, compared to those treated with CsA and antimetabolite. When sirolimus and CsA or Tac were used in combination, 61% and 66%, respectively, more PTDM occurred than with the CsA regimen.
In a study evaluating the effects of EVL with low-dose CsA and steroids in
Material and Methods
STUDY DESIGN, ELIGIBILITY, AND PATIENT ALLOCATION:
This was a multicenter, open-label, randomized, parallel study to evaluate the prevention of PTDM following EVL therapy with co-administration of low-dose Tac. The definition of PTDM conformed to the definition of the American Diabetes Association [20]. This study (NCT02036554) was conducted according to the ethical principles of the Declaration of Helsinki and the International Conference on Harmonization-Good Clinical Practice. All ethics committees and regulatory authorities approved the protocol (CRAD001AKR11T).
Patients aged ≥20 years who signed informed consent received a screening test and then were allocated with randomization into 2 groups: an EVL group and a TAC group. We added EVL 6 months after KT to avoid the influence of instability in the early KT period. Patients in the TAC group were maintained on Tac with a trough level of 5 to 10 ng/mL and MPA at the same dosage as before enrollment (usually 1500 mg for CellCept® (Myrept®), 1080 mg for Myfortic®). Azathioprine or mizoribine instead of MPA was also allowed. The Tac trough level was assessed every 3 months. Patients in the EVL group received a reduced Tac dosage to reach a trough level of 2 to 5 ng/mL, and received an additional EVL with a starting dose of 0.75 mg twice a day and then increased EVL dosage to reach a trough level of 3 to 8 ng/mL. The Tac trough level was assessed every 3 months just like that of the TAC group, and the trough level of EVL was assessed at 2 and 4 weeks and then every 3 months. The drug levels were measured at each center using patient whole blood (Figure 1).
Ninety-two KT recipients were enrolled from 4 transplant centers. Inclusion/exclusion criteria are shown in Supplemenatry Table 1.
The primary outcome was incidence of PTDM at 12 months after the study allocation. The definition of PTDM was diabetes mellitus diagnosed at any time after transplantation according to the American Diabetes Association (Supplemenatry Table 2). Secondary outcomes were the change of homeostatic model assessment for insulin resistance (HOMA-IR) and HOMA-beta, oral glucose tolerance test (OGTT), prescription rate of anti-diabetic medication or insulin, allograft function assessed by allograft survival, patient survival, estimated glomerular filtration rate (eGFR) measured using the modification of diet and renal disease (MDRD)-equation, proportion of patients with significant proteinuria and microalbuminuria (MAU), incidence of biopsy-proven acute rejection (BPAR), all-cause hospitalization, and incidence of BK virus infection nephropathy (BKVN) at 18 months after the KT. Acute rejection included both acute T cell-mediated and acute antibody-mediated rejection, which were diagnosed by the pathologist at each center based on the Banff classification scheme [21].
STATISTICAL ANALYSIS:
The cumulative incidence of PTDM after 12 months of allocation is presented as number and percentage and compared via relative risk with a 95% confidence interval. Continuous variables with a normal distribution are presented as the mean±standard deviation (SD), and those with a non-normal distribution are presented as the median with interquartile range. The
Results
PATIENT DISPOSITION AND BASELINE CHARACTERISTICS:
Fifteen patients failed randomization during the screening period, and a total of 77 patients were randomized to either the EVL group (n=38) or the TAC group (n=39). Twelve patients dropped out during the follow-up period (Figure 2).
The mean age of the overall patient group was 45.7±11.6 years, and 39 patients (50.6%) were male. The proportion of patients with a family history of diabetes was 7.89% in the EVL group and 5.13% in the TAC group (P=0.6748). The most common primary renal disease was primary glomerulonephritis (42.9%), followed by hypertension (22.1%). There was no significant difference in immunologic profiles, including human leukocyte antigen (HLA)-mismatch number, percent PRA, and donor type, between the 2 groups (Table 1).
INCIDENCE OF PTDM AND ANTI-DIABETIC PRESCRIPTION RATE:
The one-year cumulative PTDM incidence rate was not significantly different between the EVL and TAC groups (EVL vs. TAC; 13.16% vs. 2.56%, p=0.0819 in the ITT population; 11.11% vs. 2.63%, p=0.1725 in the PP population) (Table 2). Only 1 patient in the TAC group needed insulin at 12 months, and there was no significant difference between the 2 groups (P=1.0000 in both the ITT and PP populations).
INDEX FOR INSULIN RESISTANCE AND CHANGE OF OGTT:
At baseline, the average HOMA-IR and HOMA-beta values were similar between the EVL and TAC groups. There was no significant difference from baseline to 1-year HOMA-IR between the 2 groups in either the ITT and PP population (EVL vs. TAC; 0.03 vs. 0.18, p=0.2688 in the ITT population; 0.13 vs. 0.19, P=0.3213 in the PP population). In the in-group analysis, however, the TAC group showed a significant increase in HOMA-IR (1.11 to 1.30, P=0.0492) while the EVL group did not (1.13 to 1.26, P=0.7792) in the PP population. The change in HOMA-beta showed no significant difference in inter- and intra-group analyses (Table 3).
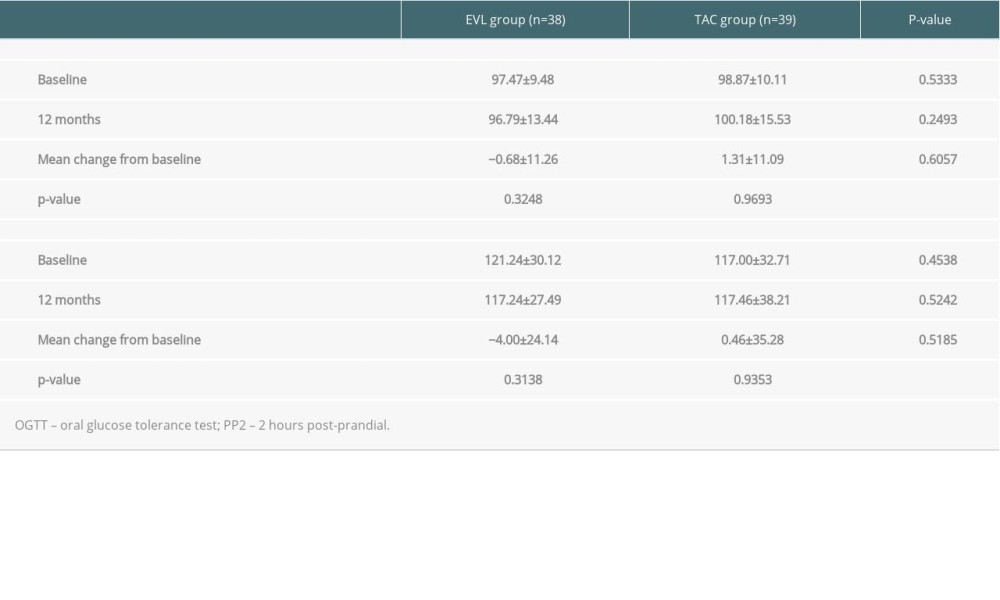
At baseline, the average values of fasting glucose and postprandial glucose at 2 h (PP2) were not significantly different between the EVL and the TAC groups. In addition, the difference of fasting and PP2 was also not different between the groups in the ITT or PP population (Supplementary Table 3).
ESTIMATED GLOMERULAR FILTRATION RATE:
In the ITT population, eGFR showed no significant difference between the 2 groups and did not differ according to post-transplant period from baseline to 12 months. In the PP population, no average eGFR values at baseline, 3, 9, and 12 months were significantly different between the 2 groups. However, eGFR values at 9 months (64.94 mL/min/1.73 m2) and 12 months (64.90 mL/min/1.73 m2) were significantly higher than the value at baseline in the EVL group (60.84 mL/min/1.73 m2) (9 months, p=0.0242; 12 months, p=0.0491) (Figure 3, Table 4).
TAC AND EVL TROUGH SERUM CONCENTRATIONS:
The mean serum trough concentration of Tac in the EVL group was 4.43 ng/mL and 5.68 ng/mL in the TAC group, which was significantly higher in the TAC group (
ALLOGRAFT REJECTION AND SURVIVAL RATE:
One case of BPAR was detected in the EVL group in the ITT population, while no rejections were identified in either group in the PP population. Allograft loss did not occur during the study period (Table 4).
MICROALBUMINURIA AND OVERT PROTEINURIA:
The average MAU values at baseline and 12 months were not different between the EVL and TAC groups. However, the EVL group showed a significant increase in MAU at 12 months after KT (225.47 to 584.04 mg/g Cr, P<0.00001), and the degree of difference from baseline to 12 months was also different between the 2 groups (EVL vs. TAC, 358.58 vs. −28.47, P=0.0035) in the ITT population. Only 1 patient in the EVL group showed overt proteinuria greater than 1 g/gCr at 12 months, and there was no difference in the inter- or intra-group analyses in the ITT population. The PP population showed similar results to the ITT population (Figure 4, Table 4).
COMPLIANCE AND SAFETY ISSUES:
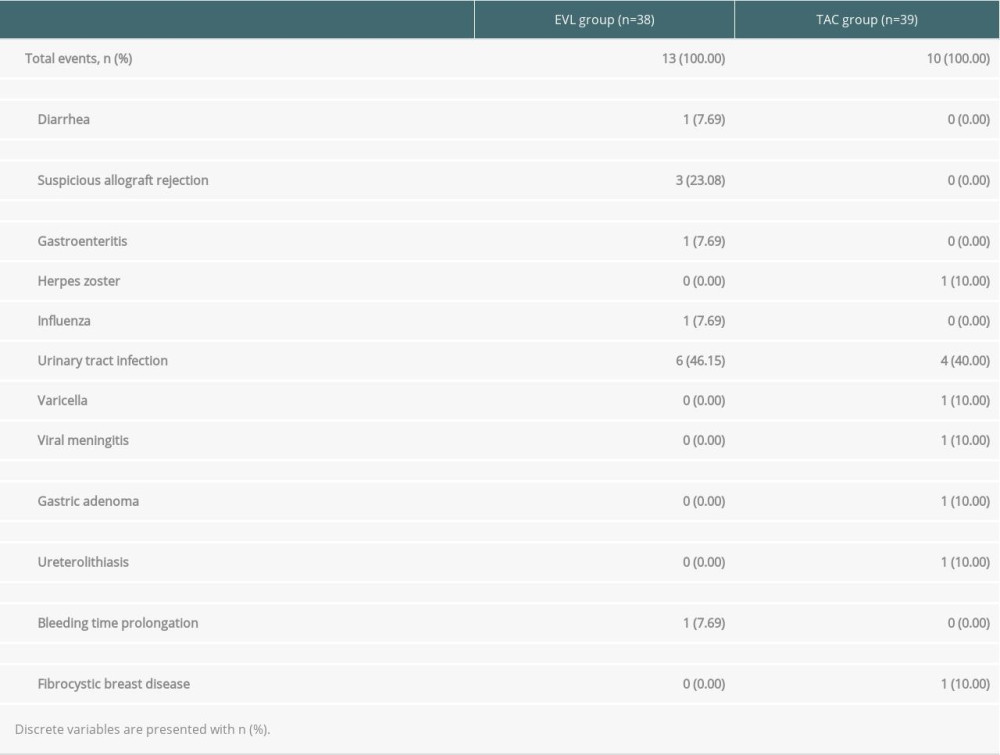
Adherence to drug was 99.9±0.42 in the EVL group and 99.97±0.13 in the TAC group during the total study period (P=0.5520). Among the 77 subjects in the ITT population, at least 1 adverse event occurred in the 37 patients of the EVL group and the 38 patients of the TAC group (P=1.0000), and serious adverse events (SAE) occurred in 9 patients of the EVL group and 8 patients of the TAC group (P=0.7373). Three cases of SAE in the EVL group were suspected to have allograft rejection, and these were excluded from the PP population. All-cause hospitalization was similar between the 2 groups. No deaths were reported during the study period (Table 5).
Discussion
This study was designed to investigate the effect of EVL treatment with a reduced exposure to Tac on the development of PTDM and allograft function. The primary endpoint, PTDM prevalence, was similar in patients who took EVL with low-dose Tac (Tac at levels from 2 to 5 ng/mL) and patients who were maintained on a standard dose of Tac at levels from 5 to 10 ng/mL. Allograft function and the incidence of BPAR were also not different between the 2 groups. These findings suggest that the addition of EVL with a low dose of Tac is an acceptable strategy for maintenance immunosuppression in KT.
The Kidney Disease: Improving Global Outcomes guidelines suggest that standard dose may be defined as it is recommended by the producer; the dose achieving 5–15 ng/mL of TAC trough levels. They also suggest using the lowest planned dose by 2–4 months after transplantation in stable KT recipients to minimize toxicity, with a low quality of evidence [22]. The results of the Symphony study showed that low-dose tacrolimus (target Tac trough level 3–7 ng/mL) may be advantageous for renal function, allograft survival, and acute rejection rates [23]. It has been reported that patients who maintained the target tac trough level of 3–7 ng/mL at 6–12 months of KT developed fewer BPARs than those maintained at 2–5 ng/mL [24]. In the present study, the target Tac trough level of the EVL group was set to 2–5 ng/mL. We expected reduced BPAR risk through the combination of EVL and Tac, and wanted to minimize Tac exposure.
The effect of EVL with low-dose Tac on PTDM development has been controversial. Some studies reported that the use of mTOR inhibitors instead of Tac reduced the prevalence of PTDM [17,19,25,26]. On the other hand, mTOR inhibitors, including EVL, are known diabetogenic drugs [18,27–29], and conversion from calcineurin inhibitors (CNI) to mTOR inhibitor even showed a trend toward increased risk of PTDM in KT recipients [30]. These discrepancies in results may be related to the timing of conversion and the dose of mTOR inhibitors and Tac.
In the present study, we added EVL 6 months after KT to avoid the influence of instability in the early KT period. The use of EVL in the early post-operative period was associated with a high incidence of wound healing adverse events [31]. In the early conversion of CNI to EVL study [32], the incidence of BPAR was 13.0% in the EVL group and 4.8% in the CsA group (
There was no statistically significant difference in HOMA-IR and HOMA-beta between baseline and 12 months in both groups in the ITT population, but HOMA-IR tended to increase in the TAC group. In addition, in the PP population, a significant increase in HOMA-IR was observed only in the TAC group. These findings can be interpreted as having relatively little effect on insulin resistance of the EVL group compared to the TAC group. However, this encouraging result did not lead to a reduction in PTDM development in the EVL group. There were 6 cases of PTDM that developed during the 1-year follow-up, 5 cases that occurred at 3 months after allocation in the EVL group, and 1 case at 12 months after allocation in the TAC group. In the safety analysis of a previous study [36], early Tac reduction plus EVL at 3 months after KT did not show a significant difference in PTDM prevalence compared to the conventional Tac dose treatment. The present study was primarily designed to evaluate the effect of EVL with low-dose Tac treatment in PTDM development and showed a similar result in the difference of PTDM prevalence. However, the cumulative incidence of PTDM seems to be low in this study (7.8%) because KT recipients who already had diabetes before 6 months after KT were excluded
In view of renal function preservation, EVL showed favorable results in that eGFR at 9 and 12 months were improved compared to baseline in the EVL group, with no improvement in the standard-dose TAC group. Tac-induced nephrotoxicity led to a demand for treatment that was less nephrotoxic and not inferior to Tac. Moreover, the mTOR inhibitor was identified as an alternative immunosuppressant due to its renoprotective effect in its early periods. Several studies have reported that EVL with reduced CNIs improves renal function [36,39–43].
However, a key hurdle for any alternative drug used for the reduction of Tac exposure is associated with the relatively high risk of acute rejection in current medical settings. Several reports have warned of the possible increase of acute rejection risk with EVL plus Tac withdrawal or low-dose Tac versus the standard Tac regimen [44,45]. In the present study, 3 cases of allograft rejection were reported in the EVL group, and all were excluded from the PP population due to drug discontinuation based on the judgement of the clinician. Although the total number of allograft rejections was numerically higher in the EVL group (n=4) relative to the TAC group (n=0), the difference was not statistically significant, and the relationship of rejection with the use of EVL and BPAR was not certain in 3 of these 4 cases.
The safety profiles of the 2 groups were generally comparable. The incidence of BKVN was similar between the groups (
There are some limitations to this study. First, the small number of participants with a small number of events may have reduced the power of the study to identify statistical differences. We enrolled patients in the first 6 months after KT to avoid bias resulting from possible instability in the early post-transplant period, like infection or post-operative complications. Therefore, all patients with PTDM events that occurred before 6 months after KT were excluded from the study. Second, the follow-up period of the study was 1 year, which is too short to reveal the long-term allograft outcomes and PTDM prevalence with EVL therapy.
Conclusions
EVL-based immunosuppressive therapy with low-dose Tac could be a safer alternative for maintenance treatment. The EVL group showed lower insulin resistance and higher allograft function in comparison to the TAC group, which suggests that we can consider this regimen for patients with a high risk of PTDM. Further long-term follow-up research with a large cohort is necessary to determine the effect of EVL-facilitated Tac reduction on PTDM and allograft function.
Figures
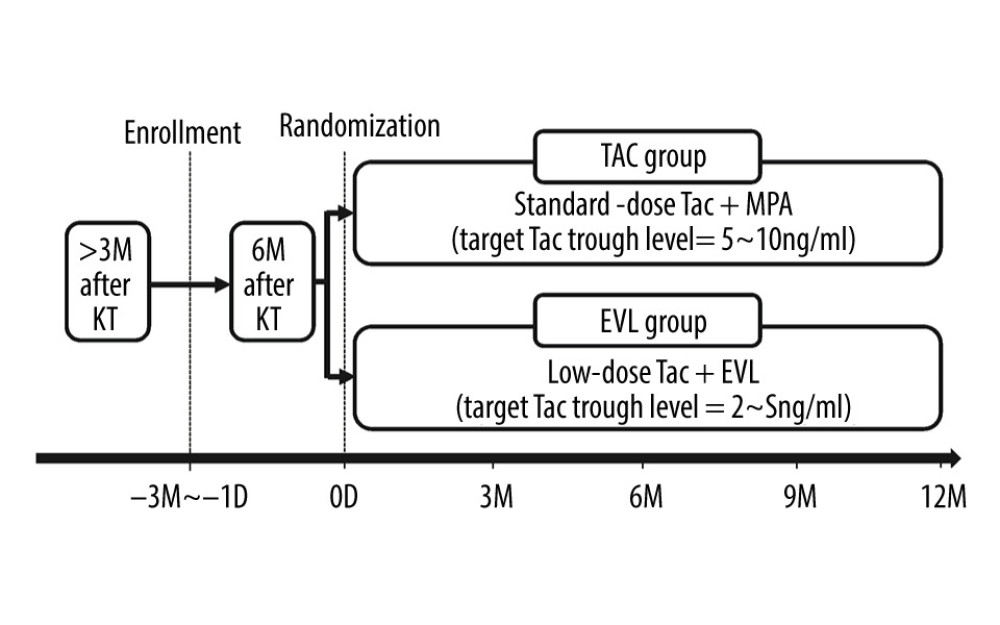 Figure 1. Overview of study protocol. The KT recipients who signed informed consents were allocated with randomization into 2 groups: “EVL group” or “TAC group,” at 6 months after KT. KT – kidney transplantation; Tac – tacrolimus; EVL – everolimus; D – day; M – month.
 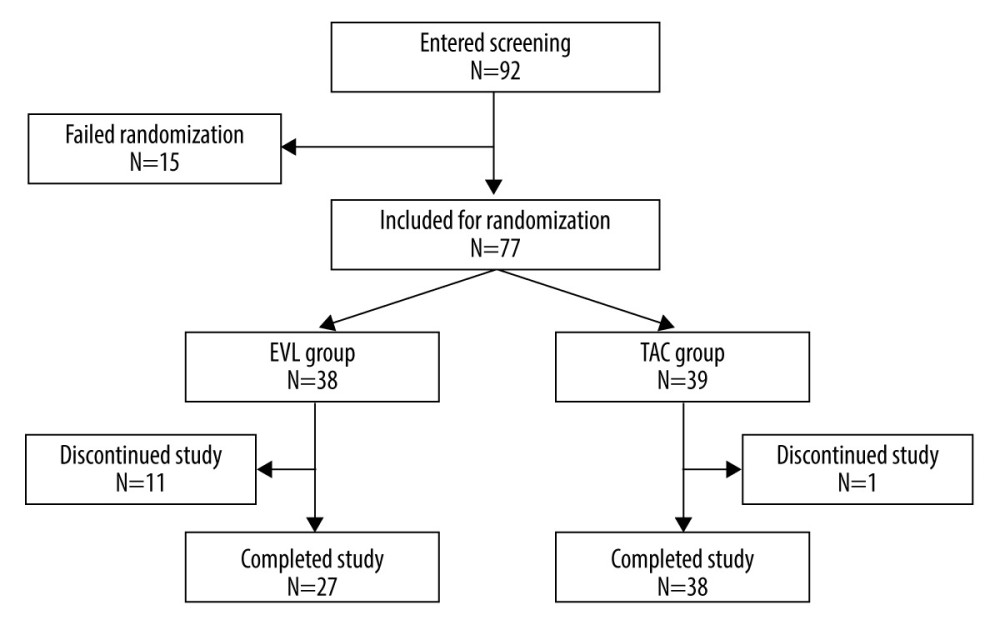 Figure 2. Allocation of the patients.
 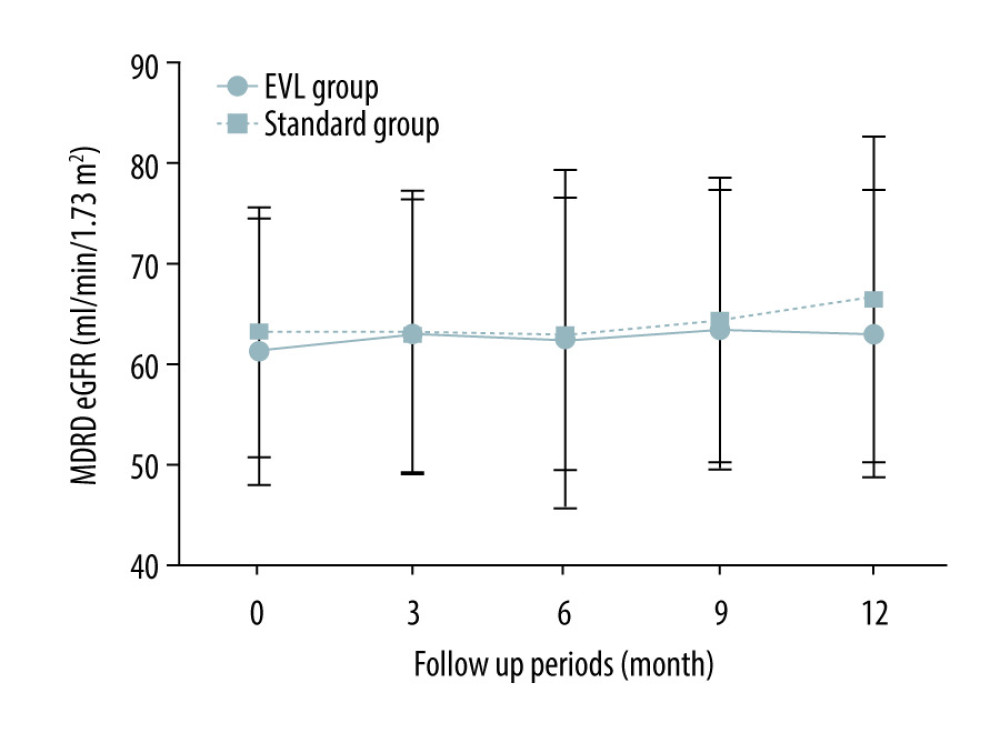 Figure 3. Change of allograft function in ITT population. The figure shows the course of the mean MDRD eGFR from the baseline to 12 months in the ITT population. Vertical error bars indicate the respective standard deviations. MDRD – modified diet and renal disease; eGFR – estimated glomerular filtration rate; ITT – intention-to-treat.
 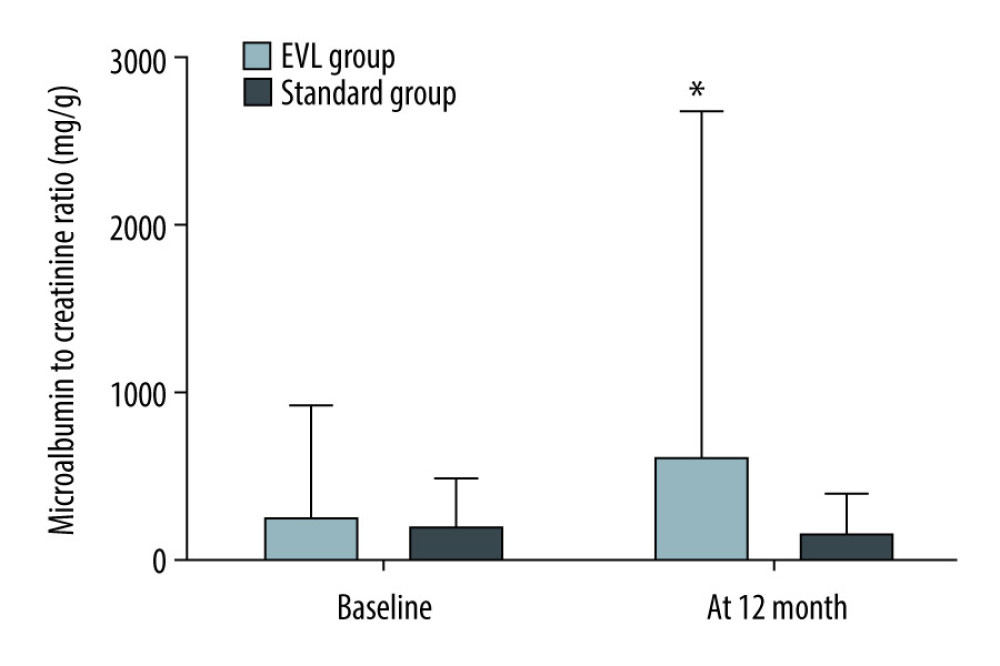 Figure 4. Change of microalbuminuria. The figure shows the difference in MAU from the baseline to 12 months in the EVL (black column) and standard group (white column). Vertical error bars indicate the respective standard deviations. MAU – microalbuminuria; EVL – everolimus * P<0.05 compared to baseline.
 Tables
Table 1. Comparison of baseline characteristics (ITT population).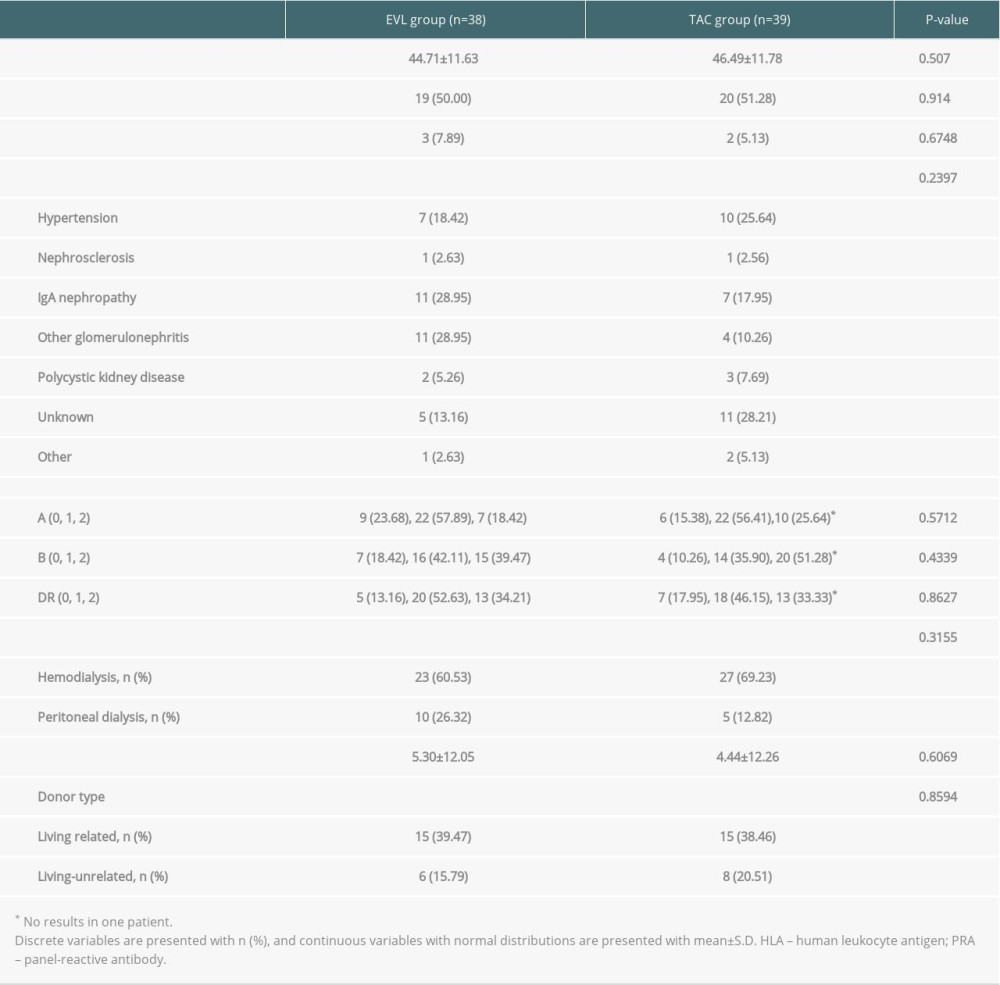 Table 2. Comparison of development of NODAT (ITT population).
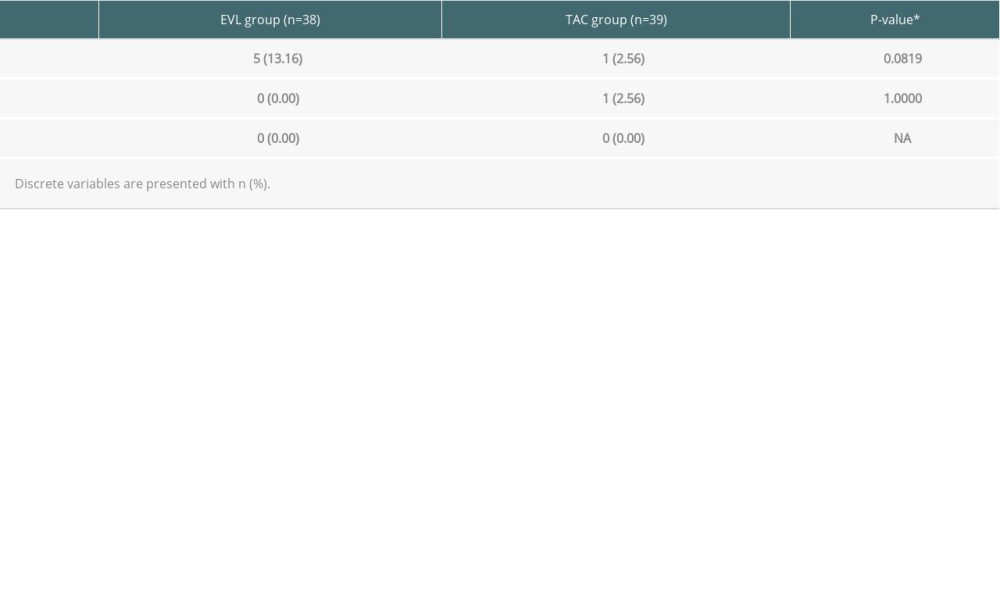 Table 3. Comparison of homeostatic model assessment for insulin resistance.
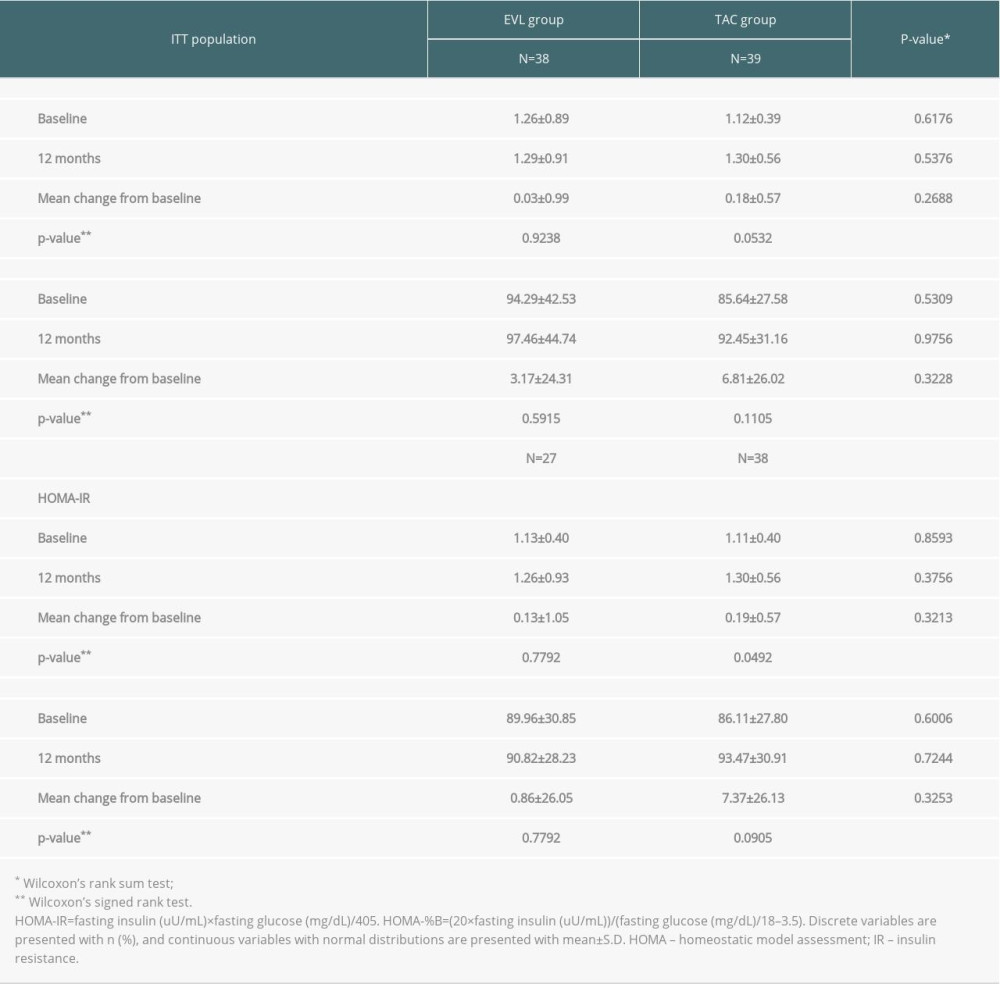 Table 4. Comparison of the allograft function.
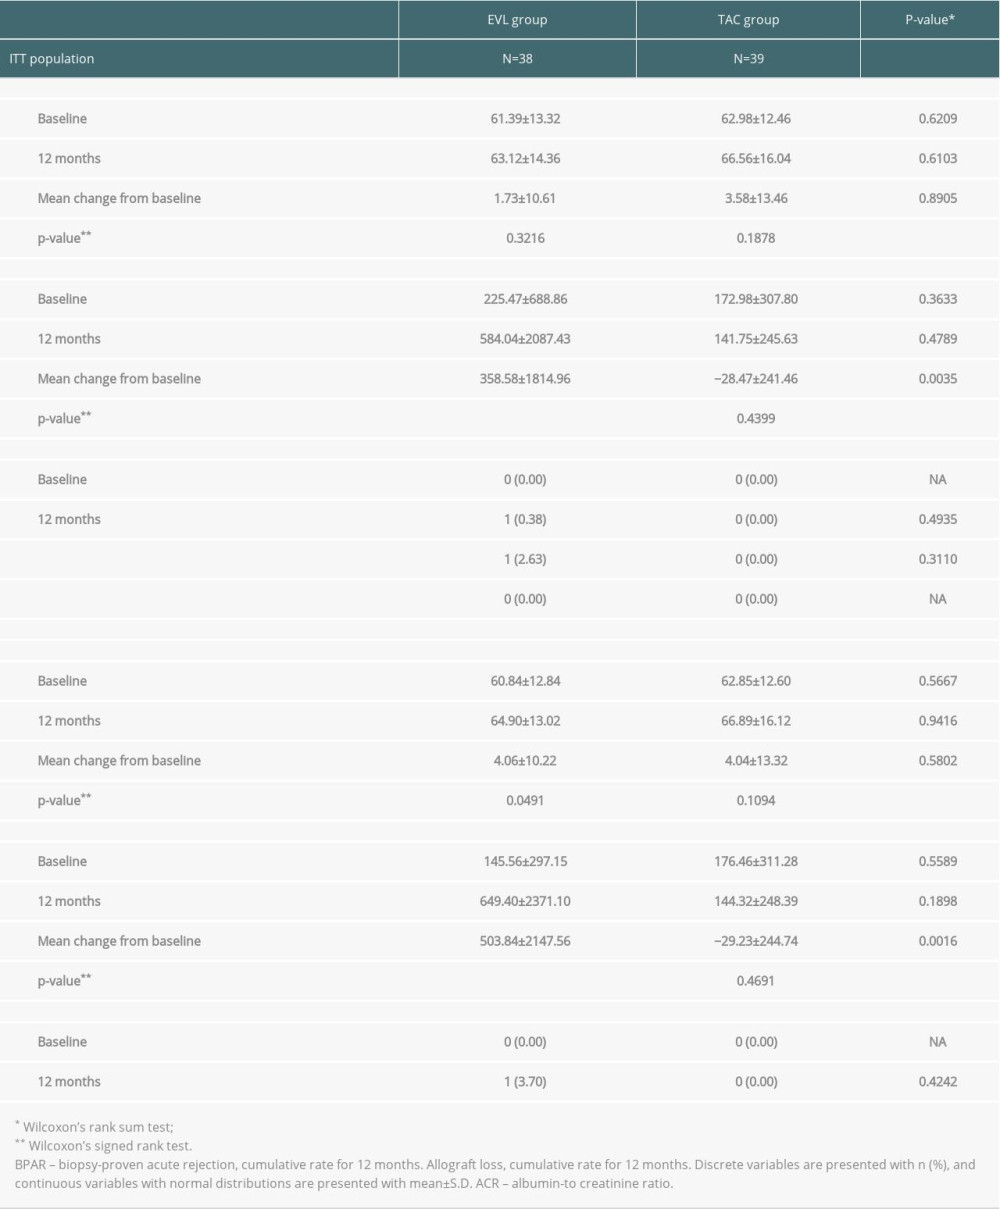 Table 5. Serious adverse events in ITT population.
 Supplementary Table 1. Inclusion and exclusion criteria.
 Supplementary Table 2. The definition of PTDM.
 Supplementary Table 3. Comparison of the oral glucose tolerance test.
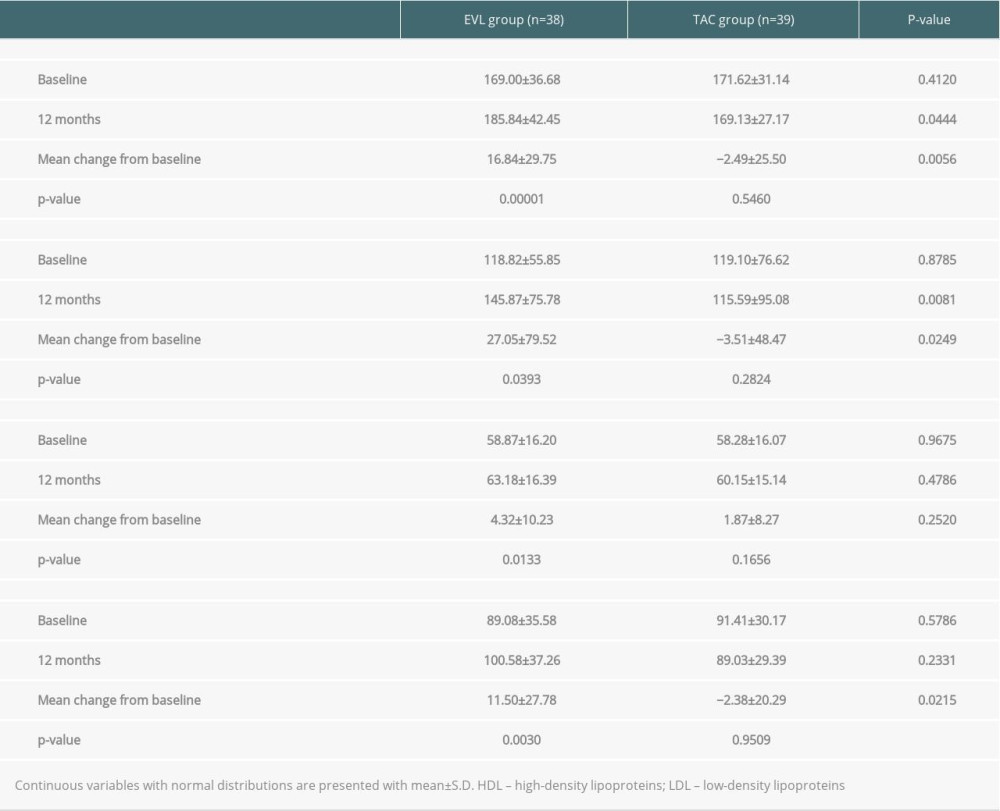
 Supplementary Table 4. Comparison of lipid profiles.
References
1. Kaplan B, Schold JD, Meier-Kriesche HU, Long-term graft survival with neoral and tacrolimus: A paired kidney analysis: J Am Soc Nephrol, 2003; 14; 2980-84
2. Webster A, Woodroffe RC, Taylor RS, Tacrolimus versus cyclosporin as primary immunosuppression for kidney transplant recipients: Cochrane Database Syst Rev, 2005(4); CD003961
3. Krämer BK, Montagnino G, Krüger B, Efficacy and safety of tacrolimus compared with ciclosporin-A in renal transplantation: 7-year observational results: Transpl Int, 2016; 29; 307-14
4. Coemans M, Süsal C, Döhler B, Analyses of the short- and long-term graft survival after kidney transplantation in Europe between 1986 and 2015: Kidney Int, 2018; 94; 964-73
5. Jenssen T, Hartmann A, Emerging treatments for post-transplantation diabetes mellitus: Nat Rev Nephrol, 2015; 11; 465-77
6. Kasiske BL, Snyder JJ, Gilbertson D, Matas AJ, Diabetes mellitus after kidney transplantation in the United States: Am J Transplant, 2003; 3; 178-85
7. Yates CJ, Fourlanos S, Hjelmesaeth J, New-onset diabetes after kidney transplantation-changes and challenges: Am J Transplant, 2012; 12; 820-28
8. Hjelmesaeth J, Hartmann A, Leivestad T, The impact of early-diagnosed new-onset post-transplantation diabetes mellitus on survival and major cardiac events: Kidney Int, 2006; 69; 588-95
9. Dienemann T, Fujii N, Li Y, Long-term patient survival and kidney allograft survival in post-transplant diabetes mellitus: A single-center retrospective study: Transpl Int, 2016; 29; 1017-28
10. Woodward RS, Schnitzler MA, Baty J, Incidence and cost of new onset diabetes mellitus among U.S. wait-listed and transplanted renal allograft recipients: Am J Transplant, 2003; 3; 590-98
11. Jenssen T, Hartmann A, Prevention and management of transplant-associated diabetes: Expert Opin Pharmacother, 2011; 12; 2641-55
12. First MR, Dhadda S, Croy R, New-onset diabetes after transplantation (NODAT): an evaluation of definitions in clinical trials: Transplantation, 2013; 96; 58-64
13. Rodrigo E, Fernandez-Fresnedo G, Valero R, New-onset diabetes after kidney transplantation: risk factors: J Am Soc Nephrol, 2006; 17; S291-95
14. Vincenti F, Friman S, Scheuermann E, Results of an international, randomized trial comparing glucose metabolism disorders and outcome with cyclosporine versus tacrolimus: Am J Transplant, 2007; 7; 1506-14
15. Tugcu M, Kasapoglu U, Boynuegri B, Tacrolimus-induced diabetic ketoacidosis and effect of switching to everolimus: A case report: Transplant Proc, 2015; 47; 1528-30
16. Veroux M, Tallarita T, Corona D, Conversion to sirolimus therapy in kidney transplant recipients with new onset diabetes mellitus after transplantation: Clin Dev Immunol, 2013; 2013 496974
17. Kälble F, Seckinger J, Schaier M, Switch to an everolimus-facilitated cyclosporine A sparing immunosuppression improves glycemic control in selected kidney transplant recipients: Clin Transplant, 2017; 31(8); ctr.13024
18. Johnston O, Rose CL, Webster AC, Gill JS, Sirolimus is associated with new-onset diabetes in kidney transplant recipients: J Am Soc Nephrol, 2008; 19; 1411-18
19. Vitko S, Tedesco H, Eris J, Everolimus with optimized cyclosporine dosing in renal transplant recipients: 6-month safety and efficacy results of two randomized studies: Am J Transplant, 2004; 4; 626-35
20. Inzucchi SE, Bergenstal RM, Buse JB, Management of hyperglycemia in type 2 diabetes: a patient-centered approach: Position statement of the American Diabetes Association (ADA) and the European Association for the Study of Diabetes (EASD): Diabetes Care, 2012; 35; 1364-79
21. Jeong HJ, Diagnosis of renal transplant rejection: Banff classification and beyond: Kidney Res Clin Pract, 2020; 39; 17-31
22. , KDIGO clinical practice guideline for the care of kidney transplant recipients: Am J Transplant, 2009; 9(Suppl 3); S1-155
23. Ekberg H, Tedesco-Silva H, Demirbas A, Reduced exposure to calcineurin inhibitors in renal transplantation: N Engl J Med, 2007; 357; 2562-75
24. Jung HY, Cho SY, Choi JY, Comparison of transplant outcomes for low-level and standard-level tacrolimus at different time points after kidney transplantation: J Korean Med Sci, 2019; 34; e103
25. Flechner SM, Glyda M, Cockfield S, The ORION study: Comparison of two sirolimus-based regimens versus tacrolimus and mycophenolate mofetil in renal allograft recipients: Am J Transplant, 2011; 11; 1633-44
26. Kramer BK, Neumayer HH, Stahl R, Graft function, cardiovascular risk factors, and sex hormones in renal transplant recipients on an immunosuppressive regimen of everolimus, reduced dose of cyclosporine, and basiliximab: Transplant Proc, 2005; 37; 1601-4
27. Chakkera HA, Weil EJ, Pham PT, Can new-onset diabetes after kidney transplant be prevented?: Diabetes Care, 2013; 36; 1406-12
28. Peddi VR, Wiseman A, Chavin K, Slakey D, Review of combination therapy with mTOR inhibitors and tacrolimus minimization after transplantation: Transplant Rev (Orlando), 2013; 27; 97-107
29. Vergès B, mTOR and cardiovascular diseases: Diabetes mellitus: Transplantation, 2018; 102(2S Suppl 1); S47-49
30. Murakami N, Riella LV, Funakoshi T, Risk of metabolic complications in kidney transplantation after conversion to mTOR inhibitor: A systematic review and meta-analysis: Am J Transplant, 2014; 14; 2317-27
31. Ueno P, Felipe C, Ferreira A, Wound healing complications in kidney transplant recipients receiving everolimus: Transplantation, 2017; 101; 844-50
32. Budde K, Lehner F, Sommerer C, Conversion from cyclosporine to everolimus at 4.5 months posttransplant: 3-year results from the randomized ZEUS study: Am J Transplant, 2012; 12; 1528-40
33. Ghisdal L, Van Laecke S, Abramowicz MJ, New-onset diabetes after renal transplantation: Risk assessment and management: Diabetes Care, 2012; 35; 181-88
34. Naesens M, Kuypers DRJ, Sarwal M, Calcineurin inhibitor nephrotoxicity: Clin J Am Soc Nephrol, 2009; 4; 481-508
35. Hecking M, Haidinger M, Döller D, Early basal insulin therapy decreases new-onset diabetes after renal transplantation: J Am Soc Nephrol, 2012; 23; 739-49
36. Langer RM, Hene R, Vitko S, Everolimus plus early tacrolimus minimization: A phase III, randomized, open-label, multicentre trial in renal transplantation: Transpl Int, 2012; 25; 592-602
37. Lane JT, Dagogo-Jack S, Approach to the patient with new-onset diabetes after transplant (NODAT): J Clin Endocrinol Metab, 2011; 96; 3289-97
38. Cosio FG, Pesavento TE, Kim S, Patient survival after renal transplantation: IV. Impact of post-transplant diabetes: Kidney Int, 2002; 62; 1440-46
39. De Simone P, Nevens F, De Carlis L: Am J Transplant, 2012; 12; 3008-20
40. Budde K, Zeier M, Witzke O, Everolimus with cyclosporine withdrawal or low-exposure cyclosporine in kidney transplantation from Month 3: A multicentre, randomized trial: Nephrol Dial Transplant, 2017; 32; 1060-70
41. Liu J, Liu D, Li J, Efficacy and safety of everolimus for maintenance immunosuppression of kidney transplantation: A meta-analysis of randomized controlled trials: PLoS One, 2017; 12; e0170246
42. Nojima M, Yamada Y, Higuchi Y, Immunosuppression modification by everolimus with minimization of calcineurin inhibitors recovers kidney graft function even in patients with very late conversion and also with poor graft function: Transplant Proc, 2017; 49; 41-44
43. Bemelman FJ, de Fijter JW, Kers J, Early conversion to prednisolone/everolimus as an alternative weaning regimen associates with beneficial renal transplant histology and function: The randomized-controlled MECANO trial: Am J Transplant, 2017; 17; 1020-30
44. Qazi Y, Shaffer D, Kaplan B: Am J Transplant, 2017; 17; 1358-69
45. de Fijter JW, Holdaas H, Oyen O, Early conversion from calcineurin inhibitor- to everolimus-based therapy following kidney transplantation: Results of the randomized ELEVATE trial: Am J Transplant, 2017; 17; 1853-67
46. Ventura-Aguiar P, Campistol JM, Diekmann F, Safety of mTOR inhibitors in adult solid organ transplantation: Expert Opin Drug Saf, 2016; 15; 303-19
47. Wiseman AC, McCague K, Kim Y, The effect of everolimus versus mycophenolate upon proteinuria following kidney transplant and relationship to graft outcomes: Am J Transplant, 2013; 13; 442-49
Figures
 Figure 1. Overview of study protocol. The KT recipients who signed informed consents were allocated with randomization into 2 groups: “EVL group” or “TAC group,” at 6 months after KT. KT – kidney transplantation; Tac – tacrolimus; EVL – everolimus; D – day; M – month.
 Figure 2. Allocation of the patients.
 Figure 3. Change of allograft function in ITT population. The figure shows the course of the mean MDRD eGFR from the baseline to 12 months in the ITT population. Vertical error bars indicate the respective standard deviations. MDRD – modified diet and renal disease; eGFR – estimated glomerular filtration rate; ITT – intention-to-treat.
 Figure 4. Change of microalbuminuria. The figure shows the difference in MAU from the baseline to 12 months in the EVL (black column) and standard group (white column). Vertical error bars indicate the respective standard deviations. MAU – microalbuminuria; EVL – everolimus * P<0.05 compared to baseline.
 Tables
 Table 1. Comparison of baseline characteristics (ITT population).
 Table 2. Comparison of development of NODAT (ITT population).
 Table 3. Comparison of homeostatic model assessment for insulin resistance.
 Table 4. Comparison of the allograft function.
 Table 5. Serious adverse events in ITT population.
 Table 1. Comparison of baseline characteristics (ITT population).
 Table 2. Comparison of development of NODAT (ITT population).
 Table 3. Comparison of homeostatic model assessment for insulin resistance.
 Table 4. Comparison of the allograft function.
 Table 5. Serious adverse events in ITT population.
 Supplementary Table 1. Inclusion and exclusion criteria.
 Supplementary Table 2. The definition of PTDM.
 Supplementary Table 3. Comparison of the oral glucose tolerance test.
 Supplementary Table 4. Comparison of lipid profiles.
 In Press
15 Mar 2024 : Review article
Approaches and Challenges in the Current Management of Cytomegalovirus in Transplant Recipients: Highlighti...Ann Transplant In Press; DOI: 10.12659/AOT.941185
18 Mar 2024 : Original article
Does Antibiotic Use Increase the Risk of Post-Transplantation Diabetes Mellitus? A Retrospective Study of R...Ann Transplant In Press; DOI: 10.12659/AOT.943282
20 Mar 2024 : Original article
Transplant Nephrectomy: A Comparative Study of Timing and Techniques in a Single InstitutionAnn Transplant In Press; DOI: 10.12659/AOT.942252
28 Mar 2024 : Original article
Association Between FEV₁ Decline Rate and Mortality in Long-Term Follow-Up of a 21-Patient Pilot Clinical T...Ann Transplant In Press; DOI: 10.12659/AOT.942823
Most Viewed Current Articles
05 Apr 2022 : Original article
Impact of Statins on Hepatocellular Carcinoma Recurrence After Living-Donor Liver TransplantationDOI :10.12659/AOT.935604
Ann Transplant 2022; 27:e935604
12 Jan 2022 : Original article
Risk Factors for Developing BK Virus-Associated Nephropathy: A Single-Center Retrospective Cohort Study of ...DOI :10.12659/AOT.934738
Ann Transplant 2022; 27:e934738
22 Nov 2022 : Original article
Long-Term Effects of Everolimus-Facilitated Tacrolimus Reduction in Living-Donor Liver Transplant Recipient...DOI :10.12659/AOT.937988
Ann Transplant 2022; 27:e937988
15 Mar 2022 : Case report
Combined Liver, Pancreas-Duodenum, and Kidney Transplantation for Patients with Hepatitis B Cirrhosis, Urem...DOI :10.12659/AOT.935860
Ann Transplant 2022; 27:e935860


