18 November 2022: Original Paper
Altered Serum Bile Acid Profile Associated with Chronic Allograft Dysfunction in Kidney Transplant Recipients
Yamei Li1ACDE, Hua Zhang23CFG, Xinhua Dai1BC, Yunfei AnDOI: 10.12659/AOT.937974
Ann Transplant 2022; 27:e937974
Abstract
BACKGROUND: Chronic allograft dysfunction (CAD) is the leading cause of graft loss among kidney transplant recipients (KTRs). Bile acids (BAs) play an important role in regulating inflammatory process, which is the major contributor to the development of CAD. The aim of this study was to evaluate the association between BAs metabolic dysregulation and CAD in KTRs.
MATERIAL AND METHODS: Fifteen serum BA species were determined in 43 healthy controls (HCs) and 131 KTRs by UPLC-MS/MS. KTRs were grouped into stable renal function (STA) and CAD1 and CAD2 groups based on eGFR levels. Circulating CYP7A1, CYP7B1, CYP27A1, and SLCO2B1 mRNA levels were determined by RT-PCR.
RESULTS: Total BA concentrations were comparable among the 4 groups. However, KTRs showed significantly different BAs profiling compared to HCs. KTRs with severe CAD (CAD2) had significantly lower unconjugated BAs and secondary BAs (SBAs) compared to the other 3 groups. KTRs had significantly lower SBAs/primary BAs (PBAs) ratios than HCs, which were comparable among the 3 KTR groups. Conjugated/unconjugated BAs ratios increased significantly with the deterioration of allograft function, which was further confirmed by correlation analysis. Differential correlation network analysis revealed that perturbations in intraclass and interclass BA coregulation existed during CAD progression. Moreover, relative gene expressions of CYP7B1 and CYP27A1 were positively correlated with eGFR.
CONCLUSIONS: BA species profiling, but not total BA concentrations, was significantly altered in KTRs with CAD. The shifts from unconjugated BAs toward conjugated BAs, SBAs toward PBAs, and distinct pairwise BAs coregulation patterns were the main characteristics of KTRs with CAD.
Keywords: Bile Acids and Salts, Kidney Transplantation, Humans, Chromatography, Liquid, tandem mass spectrometry, Allografts
Background
Kidney transplantation (KT) is the most effective treatment for patients with end-stage renal disease (ESRD). Although the short-term survival rate has been remarkably improved over the past decades, chronic progressive graft loss remains a difficult problem in the field of KT. A wide spectrum of etiologies, including cellular- and antibody-mediated rejection, immunosuppressive drugs toxicity, and recurrence of native kidney disease, are involved in kidney allograft injury and graft function decline [1], which further lead to the imbalance of water, electrolytes, acid base, and metabolites. Recently, a relatively new concept called “gut-kidney axis”, which refers to the pathogenic interconnection between gut microbiota (including their metabolites) and the kidney organ, has been implicated in various kidney diseases such as acute kidney injury (AKI), chronic kidney disease (CKD), and immunoglobulin A (IgA) nephropathy [2,3]. Also, as essential metabolites of gut microbiota, the alteration of bile acids (BAs) concentration and composition were revealed to be associated with host signaling in kidney diseases [4,5], which suggests the potential pathogenic role of BAs in kidney damage. However, whether BAs metabolism dysregulation is presented in kidney transplant recipients (KTRs) with chronic allograft dysfunction (CAD), who are facing the challenges of alloimmune response and lifelong immunosuppressive drugs, remains to be clarified.
There are 2 major categories of BAs – primary BAs (PBAs) and secondary BAs (SBAs) – which are synthesized in the liver and intestine, respectively. Unconjugated PBAs are lipid-soluble molecules initially synthesized in the liver from cholesterol through primary and alternative pathways [6]. The PBAs are then amidated with either glycine or taurine to form water-soluble conjugated PBAs. These conjugated PBAs travel to and are stored in the gallbladder temporarily. During digestion, the majority of BAs are delivered to the duodenum via the biliary tract and are recycled through enterohepatic circulation. The remaining 5% of BAs are not reabsorbed and undergo biotransformation by microbiota in the colon to form SBAs, which will either be transferred back to the liver via the portal vein or excreted in the feces [7]. With the in-depth investigation of their function, BAs are not only considered as an emulsifier to promote fat utilization and activate lipase to improve fat digestibility, but also present other essential biological functions such as inflammatory regulation, gluconeogenesis and lipid synthesis via the interaction with its nuclear (farnesoid X receptor, FXR), and cell-surface (Takeda G protein-coupled receptor 5, TGR5) receptors [8].
CAD is a multifactorial process characterized by progressive interstitial fibrosis and tubular atrophy (IF/TA), deterioration of renal allograft function, and proteinuria. Inflammation is the core contributor leading to the development and progression of CAD. In addition, growing evidence has revealed that immunosuppressive drugs and transplantation itself can significantly change the composition and diversity of microbiomes [9–12], which in turn affects the outcomes of grafts. Considering the central role of BAs in the regulation of both inflammation and microbiota [13–15], we speculated that BAs profiles might be altered and present associations with undesirable outcomes in KTRs. Therefore, in this study, we quantified the absolute concentration and composition of 15 serum BA species in KTRs with different renal allograft function, aiming to evaluate the association of BAs patterns alteration and BAs metabolic dysregulation in KTRs with CAD.
Material and Methods
STUDY POPULATION:
We cross-sectionally included 131 KTRs who underwent KT and have regularly follow-ups in our medical center. We randomly selected 43 healthy controls (HCs) in the same period. KTRs were enrolled if they met the following criteria: 1) Received standard triple regimen (tacrolimus + mycophenolate mofetil + prednisone) as maintenance immunosuppression, 2) age at transplantation >18 years old, and 3) no history of digestive system diseases. KTRs were divided into 3 subgroups according to the modified chronic kidney disease (CKD) grading criteria of Kidney Disease Improving Global Outcomes (KDIGO) [16]. At the time of the sample collection, KTRs with estimated glomerular filtration rate levels (eGFR, calculated by CKD-EPI formula) greater than 60, between 30 and 60 and less than 30 ml/min/1.73m2 for more than 3 months were classified into the stable group (STA, N=56), CAD1 (N=51), and CAD2 (N=24), respectively. This study was performed in accordance with the tenets of the Helsinki Declaration and was approved by the Institutional Review Board of West China Hospital.
SAMPLE COLLECTION AND PRETREATMENT:
Serum samples were collected after centrifugation and stored in aliquots at −80°C until the determination of BAs profile. Fresh EDTA-anticoagulated peripheral blood samples were collected from KTRs (before the morning dose of immunosuppressants) and HCs. White blood cells (WBC) were isolated after erythrolysis and then stabilized in Trizol reagent at −80°C until mRNA quantification was required.
BAS MEASUREMENT AND SUBGROUPING:
BA assay kit was purchased from Qlife Lab (Nanjing, China). BA components were extracted from the serum samples strictly according to the manufacturer’s instructions. Serum BAs were analyzed using a Waters ACQUITY ultra performance liquid chromatography (UPLC) system coupled with a Waters XEVO TQ-S mass spectrometer with an ESI source controlled by MassLynx 4.1 software. An ACQUITY BEH C18 column (1.7 uM, 100×2.1 mm internal dimensions) (Waters) was used to perform chromatographic separations. Standard curves and internal standards were used for the purpose of quantifying BA metabolites concentrations. Corresponding high and low controls were employed to ensure the accuracy of detection. Fifteen BAs were determined in this study and the precursor and product ion pairs were as follows: cholic acid (CA) (407.3>407.3), chenodeoxycholic acid (CDCA) (391.3>391.3), glycocholic acid (GCA) (464.3>73.95), taurocholic acid (TCA) (514.35>80.01), glycochenodeoxycholic acid (GCDCA) (448.3>73.95), taurochenoxycholic acid (TCDCA) (498.3>80.1), deoxycholic acid (DCA) (391.3>391.3), lithocholic acid (LCA) (375.3>375.3), ursodeoxycholic acid (UDCA) (391.3>391.3), glycodeoxycholic acid (GDCA) (448.3>73.95), glycolithocholic acid (GLCA) (432.3>73.95), aurodeoxycholic acid (TDCA) (498.3>80.1), tauroursodeoxycholic acid (TUDCA) (498.3>80.1), glycoursodeoxycholic acid (GUDCA) (448.3>73.95), and taurolithocholic acid (TLCA) (482.3>80.01).
BAs were classified into 4 subgroups based on the conjugation degree:
Ratios of selected BA metabolites were calculated to reflect the enzymatic activities involved in BA metabolism referred to the published studies [17,18].
MRNA QUANTIFICATION:
RNA was extracted from WBC using Trizol reagent according to the manufacturer’s instructions. The optical density value was measured to calculate the concentration and purity of RNA. Reverse transcription was performed with PrimeScriptTM RT reagent kit with gDNA eraser (TAKARA). Quantitative real-time polymerase chain reaction (RT-PCR) analysis was performed on TB Green (TAKARA). The primers used in this study were as follows:
Amplification was performed with a 2-step PCR protocol: 95°C for 5 minutes, followed by 40 cycles of 95°C for 10 seconds and 60°C for 30 seconds. A melting-curve analysis was applied to ensure the specificity of PCR products. The expressions of
STATISTICAL ANALYSES:
Data were presented as the absolute number, mean±standard deviation or median (interquartile range) according to the data type. Chi-square or Fisher exact tests was utilized to compare categorical variables between groups. The t test or Mann-Whitney U test was utilized to compare continuous variables with normal distribution and skewed distribution, respectively. All statistical analyses and graphs were done with SPSS (version 23.0, SPSS Inc., Chicago, IL, USA), R (version 4.2.0, https://cran.r-project.org), and GraphPad Prism (Version 9.0.1, GraphPad, La Jolla, CA, USA). Principle component analysis was completed with MetaboAnalyst (version 5.0, https://www.metaboanalyst.ca). The Spearman correlation matrix was built with the “corrplot” package. Differential correlations between BA pairs were calculated with the “DGCA” package. Only BA pairs with differential correlation (P<0.05) were imported into Cytoscape software (Version 3.7.2) [19] to achieve the visualization of correlation networks. Due to the exploratory study design property, we conducted the Bonferroni correction for multiple testing to avoid type I error. P<0.05/n (n refers to the number of comparisons) was considered statistically significant.
Results
BASELINE CHARACTERISTICS OF STUDY PARTICIPANTS:
The clinical and laboratory characteristics of study populations are presented in Table 1. Age, sex, trough concentration of tacrolimus at the sampling time point, mycophenolate mofetil (MMF) dosage forms, and mycophenolic acid area under the concentration-time curve (MPA-AUC) levels were comparable among the 4 groups. Post-transplantation time was significantly shorter in CAD1 group than that in STA and CAD2 groups. In terms of lipid profiles, KTRs in CAD1 group showed higher concentrations of cholesterol and triacylglycerol than those in the HC group. Consistent with cholesterol levels among groups, a significantly higher percentage of KTRs in the CAD1 group used statin than those in the HC group. Since liver function-related indicators of all study participants were within normal ranges, the differences of ALT level among CAD1 and HC groups had no clinical significance. KTRs with CAD showed significantly worse renal function than HCs and KTRs in the STA group, which was determined by study design. In addition, the systemic inflammatory index neutrophil-to-lymphocyte ratio (NLR) significantly increased with the deterioration of allograft function.
DIFFERENT BAS PROFILES WERE OBSERVED AMONG HC, STA, CAD1, AND CAD2 GROUPS:
The supervised partial least squares-discriminant analysis (PLS-DA) was applied for modeling BAs profile differences among HC, STA, CAD1, and CAD2 groups. In the PLS-DA score plot (Figure 1A), we observed a large overlap of samples between the HC and STA groups. However, the difference gap of BAs profiling between HC and KTRs became larger with the deterioration of renal allograft function, which indicated there might be associations between BA profile and CAD in KTRs. The composition analysis of BAs revealed that PBAs comprised 65–80% of serum total 15 tested BAs, among which conjugated PBAs account for the majority, whereas LCA, TDCA, GLCA, TUDCA, and TLCA were represented in relatively low concentrations. The composition of individual BAs was significantly different among the 4 groups. KTRs in CAD2 had significantly lower proportions of CDCA, GCDCA, and GDCA, but higher percentages of TCDCA, TCA, and GCA when compared to KTRs with stable renal function (Figure 1B). Further determination of the serum concentrations of individual BAs demonstrated that GCDCA, CDCA, and GCA are the greatest contributors to the BA spectrum. There were obvious differences in most serum BAs levels between the HC and KTR groups. With the decline of the renal allograft function, BAs showed increased or decreased trends in CAD2 subjects who had significantly lower levels of CDCA, DCA, GDCA, LCA, and GLCA, but higher level of TCA than in the STA group (Figure 1C).
COMPARISON OF BA SUBGROUP CONCENTRATIONS AND RATIOS AMONG HC, STA, CAD1, AND CAD2 GROUPS:
BA subgroup concentrations and ratios were calculated to further assess BA profile alterations in KTRs with CAD (Table 2). We found that the total BA levels, whether they were detected by enzyme cycling method or 15 BAs that were detected by LC-MS/MS, were comparable among groups. KTRs in the CAD2 group showed a much lower level of total SBAs than the other groups, but no difference was observed among HC, STA, and CAD1 groups. In addition, we observed that KTRs in the CAD2 group showed significantly lower levels of unconjugated BAs, especially unconjugated SBAs, than the other groups, while no obvious differences were found regarding total conjugated BAs, or glycine/taurine-conjugated BAs among the 3 KTR groups. To determine enzymatic activity changes in the liver and the gut, 4 types of metabolite ratios were evaluated to reflect the potential mechanisms, leading to the noted altered BAs profile in KTRs. The ratios of SBAs to PBAs (total SBAs/PBAs and DCA/CA) significantly decreased in KTRs when compared to HCs, but they were not different among KTR groups. The ratio of LCA/CDCA was significantly lower in the CAD1 group compared to the HC and STA groups, but not different from the CAD2 group. However, the ratios of conjugated to unconjugated BAs (total conj./unconj. BAs, TCA/CA, GCA/CA, TCDCA/CDCA, and GCDCA/CDCA) increased with the decline of renal function, and the CAD2 group had higher values than the other 3 groups. In addition, KTRs showed much higher values of TDCA/DCA ratio than HCs, and KTRs in the CAD2 group had the highest value.
ASSOCIATIONS BETWEEN BAS AND CLINICAL PARAMETERS:
Spearman correlation analyses were completed on all study participants. As shown in Figure 2, the results demonstrated that the sum of all 15 measured serum BAs, total PBAs, all individual PBAs, total SBAs, and some of the individual SBAs (UDCA, GUDCA, and TUDCA) were positively correlated with total bile acids (TBA), which was determined by total BA enzyme circulation method. The concentrations of taurine-conjugated BAs (including TCA, TCDCA, and TUDCA) and the ratios of Conj.BAs/Unconj.BAs, TCA/CA, TCDCA/CDCA, TDCA/DCA increased with the decline of renal function, while SBAs (DCA, LCA, GDCA, GLCA, TDCA, and TLCA), the ratios of SBAs/PBAs, DCA/CA, LCA/CDCA, and GLCA/LCA were inversely correlated to renal function. Additionally, SBAs (DCA, LCA, GDCA, GLCA, TDCA, and TLCA) and the ratios of DCA/CA, GLCA/LCA were negatively correlated with the systemic inflammatory index NLR.
DIFFERENTIAL CORRELATION NETWORK ANALYSIS OF BA COREGULATION BETWEEN HCS AND KTR GROUPS:
To comprehensively evaluate the perturbed BA coregulation underlying CAD development, we generated network plots to visualize differential correlations between various BAs pairs in the tested groups. First, the 3 KTR groups were separately compared to the HCs. The results demonstrated that there was a slight difference in BA coregulation between the HC and STA groups (Figure 3A). However, a total of 21 and 30 differential correlations of BA pairs were found between HCs versus CAD1 and HCs versus CAD2, respectively. This suggested that the worse the allograft function was, the larger the alteration of BA coregulation patterns was in KTRs with CAD when compared to HCs (Figure 3B, 3C). Then, we compared the BA coregulation patterns between the 3 KTR groups. The data showed that TUDCA and GUDCA were positively correlated with all conjugated PBAs in the STA group (blue line, ++/0 in Figure 4A), but not in KTRs from the CAD1 group, and the positive correlation between DCA and LCA (pink line, ++/+ in Figure 4A) was stronger in the STA group. In addition, 7 BA pairs (DCA and CDCA, CA, UDCA, LCA; TUDCA and UDCA, TDCA, GDCA) showed no significant correlations in the STA group, but were positively correlated with each other in the CAD1 group (Figure 4A). Similarly, 6 BA pairs had positive correlations in the STA group, but the correlation disappeared in the CAD2 group. By contrast, 18 BA pairs (brown and orange lines in Figure 4B) showed no correlations in the STA group but became positively correlated to each other in the CAD2 group. A total of 26 BA pairs were significantly differentially presented in the 2 CAD groups (Figure 4C).
COMPARISON OF CYP7A1, CYP7B1, CYP27A1, AND SLCO2B1 MRNA LEVELS IN PERIPHERAL BLOOD AMONG GROUPS:
The total RNA was extracted from peripheral WBC. Relative mRNA expression levels of CYP7A1 and SLCO2B1 in peripheral blood were extremely low, while the abundance of CYP7B1 and CYP27A1 mRNA was higher. As shown in Figure 5, KTRs in the CAD2 group presented a significantly lower relative expression of CYP7B1 and CYP27A1 mRNA levels when compared to HCs and KTRs with stable allograft function, while no significant difference was observed among groups regarding the relative gene expressions of CYP7A1 and SLCO2B1. Correlation analysis demonstrated that CYP7B1 and CYP27A1 mRNA levels were positively but weakly correlated with eGFR levels with correlation coefficients of 0.215 (P=0.034) and 0.290 (P=0.0037), respectively (Figure 6). Moreover, CYP7B1 mRNA levels showed positive correlations with total, conjugated, unconjugated, and individual SBAs species (Figure 6).
Discussion
In this study, we utilized UPLC-MS/MS assay to determine the concentration of 15 serum BAs in a cohort of healthy humans and KTRs with different renal function to systematically evaluate their potential association with CAD courses. Notably, BAs composition was obviously shifted between HCs and KTRs. Unconjugated BAs (including PBAs and SBAs) were dramatically decreased, and skewed compositional profiles of unconjugated BAs toward conjugated forms were observed in KTRs with severely impaired renal function. Moreover, differential correlation network analysis revealed that distinct perturbations in intraclass (ie, PBA and SBA) and interclass (ie, unconjugated and conjugated) BA coregulation are involved in the progression of CAD in KTRs. In addition,
It has been well established that metabolic disorders such as post-transplant diabetes, hyperparathyroidism, and obesity are highly prevalent in KTRs and can adversely influence post-transplant graft outcomes [20,21]. Considering the diverse functions of BAs signaling in glucose and lipid homeostasis, energy balance, fibrosis, and immune homeostasis [7], it is worth exploring whether BAs are involved in allograft diseases of KTRs. Although liver and intestine are the main sites for BA synthesis and biotransformation, circulating BAs are believed to fluctuate almost synchronously with the enterohepatic circulation and may reflect the overall BAs metabolic status of the body [22]. The changes of serum BAs concentration and composition actually occur in various metabolic and inflammatory diseases [23]. Thus, in this study we focused on BAs species from serum. Intriguingly, there was no significant difference among groups in TBA measured by the enzyme cycling method, nor in total 15 BAs determined by UPLC-MS/MS. However, the BAs profiles were skewed with the deterioration of allograft function and KTRs in the CAD2 group showed the most distinct spectrum when compared to other groups. In general, the changes in BAs composition and concentrations showed a similar trend among all 4 groups. The BAs profile of KTRs was significantly different from HCs. Further comparison of individual BA species among KTR groups revealed that all unconjugated BAs (CDCA, UDCA, CA, DCA, and LCA) were dramatically reduced, and excessive transition from unconjugated BAs to conjugated form (evaluated from Conj./unconj.BAs, TDCA/DCA, and GLCA/LCA values) was observed in KTRs with severe impaired allograft function, which suggested that the BAs’ amidation process may play important roles in the progression of CAD in KTRs.
Correlation analysis between BAs and clinical parameters revealed that both total SBAs and individual SBAs (TDCA, GDCA, DCA, TLCA, GLCA, and LCA) were positively correlated with renal function and were negatively correlated with the inflammatory marker NLR. In addition, the ratios of SBA to PBAs (DCA/CA and LCA/CDCA) that reflect the enzymatic activity toward shifted production of SBAs in the intestines demonstrated similar trends. SBAs are some of the most concentrated microbiota-derived gut metabolites, which are reported to be the key regulators of anti-inflammatory process through activation of the TGR5 BA receptor. Sinha et al found that externally treated colitis mice with DCA and LCA, but not CDCA, had significantly inhibited gene and protein generation of multiple inflammation-associated chemokines and cytokines (such as CCLF, CXCL10, IL17A, IFNγ, and IL-1β), which was partly mediated through TGR5 expression on immune cells [24]. Given that inflammation is an essential process contributing to CAD, it is reasonable to speculate that the lower level of SBAs in the CAD2 group directly weakened the anti-inflammatory effect of SBAs and thus participates in the pathogenesis of CAD in KTRs. In addition, a series of studies have demonstrated that BAs are potent antimicrobials that control microbial diversity in host intestines, dysbiosis of which triggered signals regulating inflammation and were significantly associated with kidney graft outcomes [12,25–27]. Therefore, the downregulation of SBAs observed in the current study may have promoted the progression of CAD through indirect regulation of gut microbiota in KTRs. Further functional and basic experiments are required to elucidate whether there is an association between BAs metabolism and microbiota and their roles and interactions in the development of CAD in KTRs.
In addition to the absolute concentration and composition of BAs, we also conducted differential correlation network analyses to investigate the global interconnection of pairwise BAs, which identified significant correlation variations between groups. Overall, our data showed that larger gaps of disease stages between groups were associated with more BA pairs with significant differential correlations. KTRs in advanced CAD stage showed more differentially correlated BA pairs to HCs than those from STA versus HC groups. Moreover, considerable altered BAs coregulation was found in pairwise comparison among the 3 KTR groups. The distinct BAs coregulation among groups therefore suggest that some BAs metabolism processes are related to the development of CAD in KTRs, which may account for the subsequent shifts of the compositional profiles of serum unconjugated BAs toward conjugated BAs, and SBAs toward PBAs. However, the exact bidirectionally regulatory mechanisms between CAD progression and BA metabolic pathway need further investigation.
Previously, due to the extremely low expression of some BA rate-limiting biosynthesis and transporter genes such as
There are several limitations to this study. First, as the kinetics and composition of BAs pool are affected by food intake and lifestyle, the lack of this information in the current study may have resulted in confounding biases affecting our results. Second, due to the inaccessibility of liver tissue from patients, we were unable to directly analyze the effect of CAD on rate-limiting enzyme expression or activity, and only ratios of BA pairs and circulating enzyme gene expression were determined to indirectly reflect the enzyme activity in the liver. Third, our data cannot address the relationship between BA profile and different pathologies because the majority of KTRs in the CAD groups did not undergo an allograft biopsy to confirm the pathological cause. Finally, gut microbiota was not assessed in the current study, which prevented us from further integrating and explaining the data on the dramatic changes of SBAs and, PBAs in the progression of CAD.
Conclusions
Our findings indicate that BA species profiling rather than total BA concentrations was significantly altered with the development and progression of CAD in KTRs. The shifts from unconjugated BAs toward conjugated BAs and SBAs toward PBAs, as well as the distinct pairwise BAs coregulation patterns, were the main characteristic changes in KTRs with CAD. Moreover, positive correlations were found between circulating BA synthesis-related enzyme
Figures
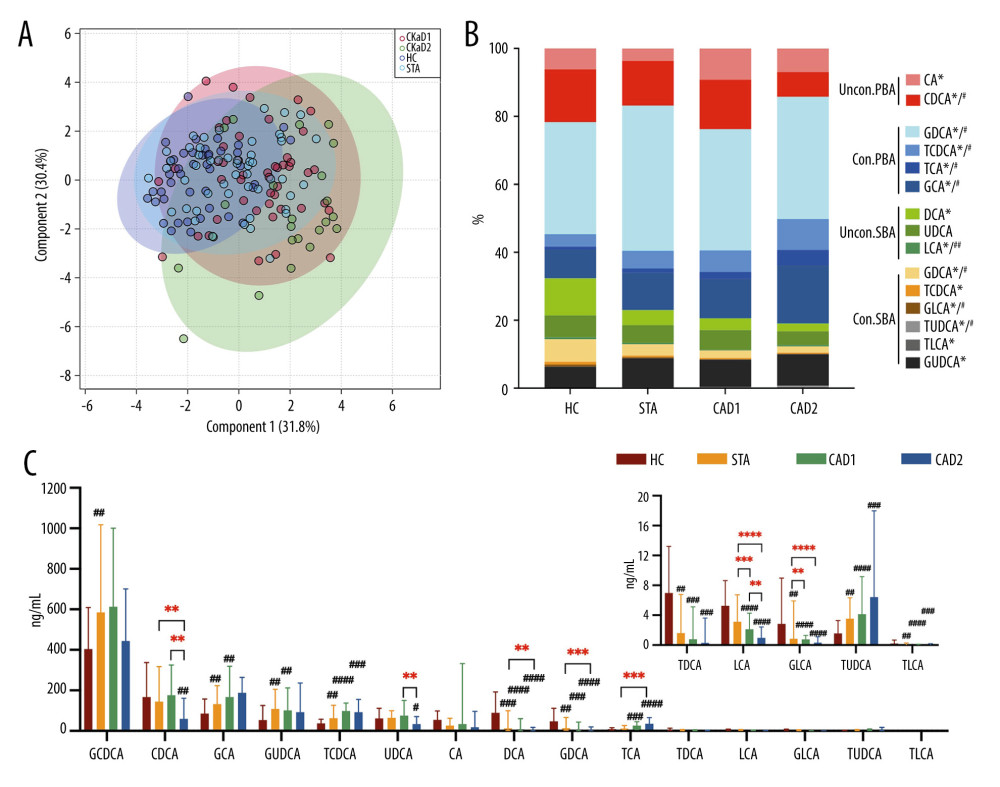 Figure 1. Comparison of BA profiling, composition, and absolute concentrations of individual BAs among HC, STA, CAD1, and CAD2 groups. (A) Supervised partial least squares-discriminant (PLS-DA) score plot based on 15 BAs. (B) Differences in the composition of BAs in 4 groups. * P<0.05 for the comparison among 4 groups. # P<0.05 for the comparison among the 3 KTR groups. (C) Serum concentrations of individual BAs in 4 groups. ## P<0.008, ### P<0.001, #### P<0.0001 vs HC group. ** P<0.008, *** P<0.001, ***** P<0.0001. Figure 1A was generated in MetaboAnalyst (version 5.0, https://www.metaboanalyst.ca). Figure 1B and 1C were generated using GraphPad Prism (Version 9.0.1, GraphPad, La Jolla).
 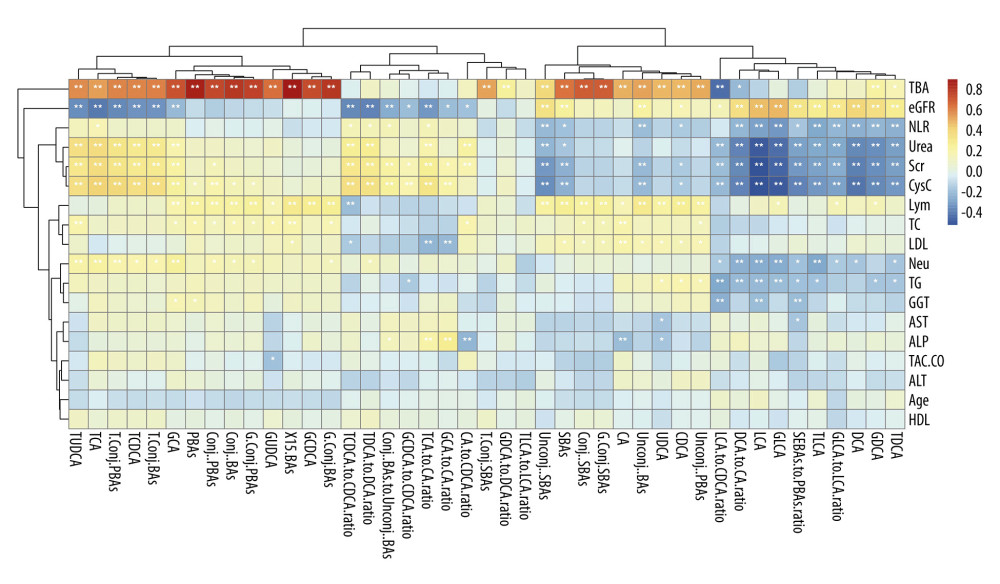 Figure 2. The correlation matrix displays the Spearman correlations between individual BAs, BA subgroup concentrations, ratios, and the main laboratory indicators. The plot was generated using R (version 4.2.0, https://cran.r-project.org) and “corrplot” package.
 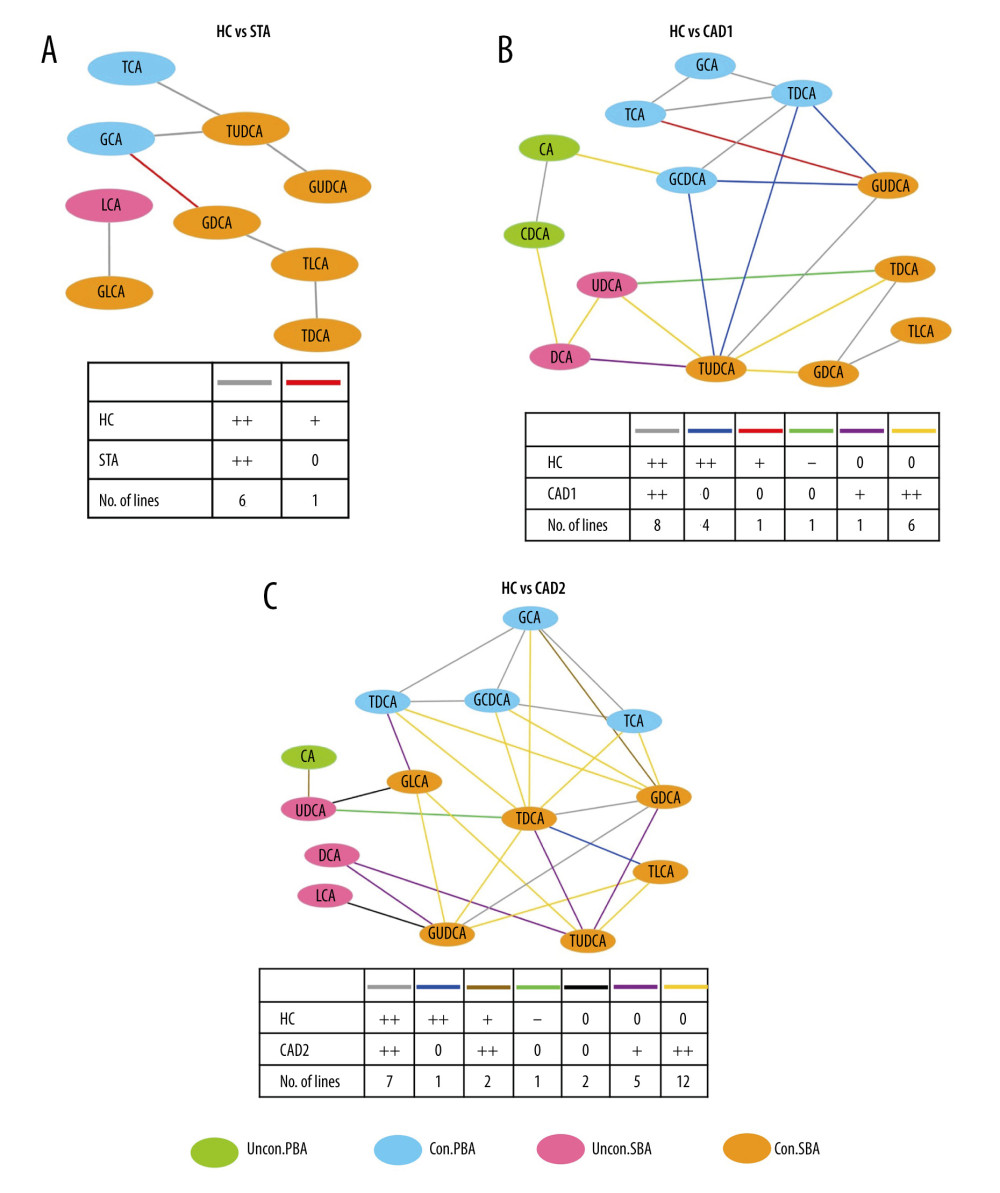 Figure 3. Differential correlation analyses of various BAs between HC and KTR groups. Network analysis illustrates the differential correlation of BAs between study groups (A–C). Only BA pairs with significant differential correlations (P<0.05) were included. The colored lines connecting BAs indicates the direction and strength of the correlation groups, and the number of lines that follows indicates the number of BA pairs in the global networks exhibiting this pattern of change. For instance, the red line +/0 1 in Figure 3A indicates that the correlation between GCA and GDCA was positive (+) in the HC group, but the correlation disappeared (0) in the STA group. Only 1 BA pair connected by red line in the network displayed this pattern of change (+/0). +P<0.05, ++P<0.01, are positively correlated; −P<0.05, is negatively correlated; 0, represents unrelated. Differential correlation coefficients between BA pairs were calculated with the “DGCA” package and the visualization of correlation networks were achieved using Cytoscape software (Version 3.7.2).
 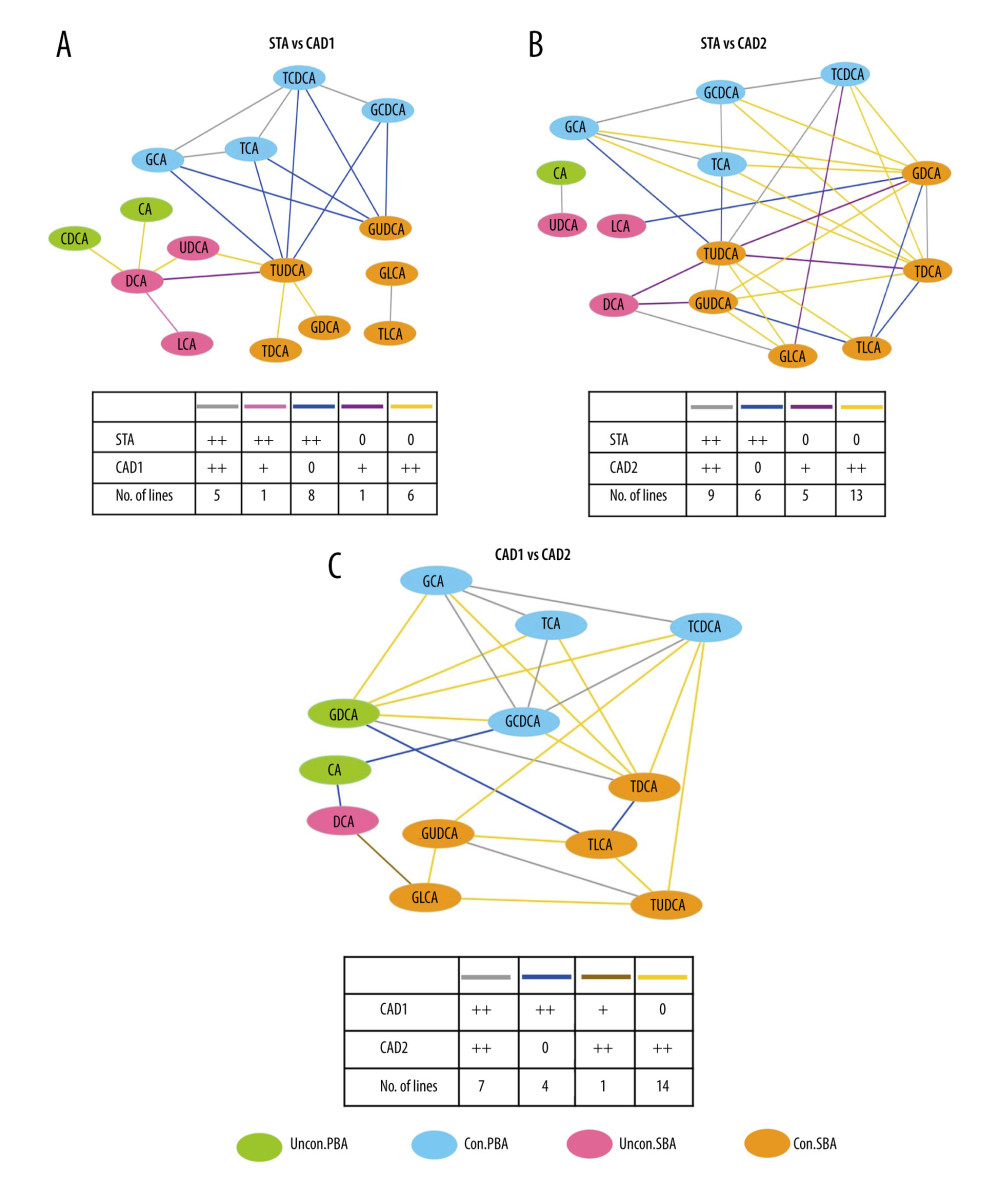 Figure 4. Differential correlation analyses of various BAs between KTR groups. Network analysis illustrates the differential correlation of BAs between the 3 KTR groups (A–C).
 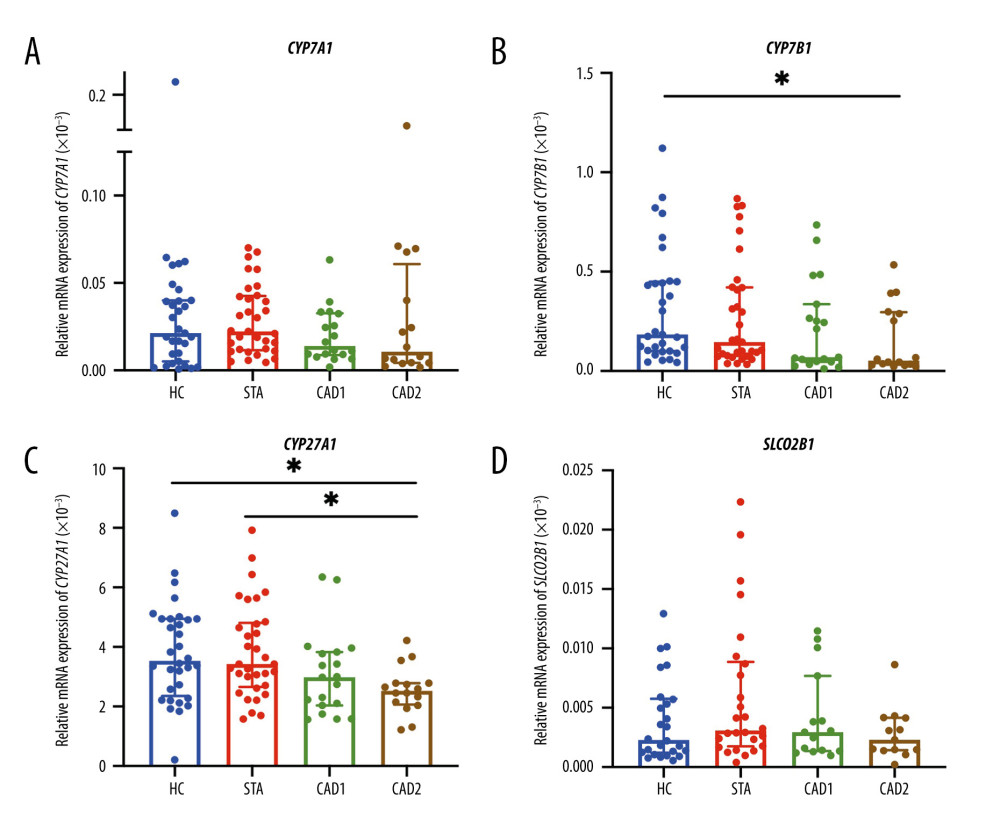 Figure 5. Relative gene expressions of CYP7A1, CYP7B1, CYP27A1, and SLCO2B1 in the peripheral blood of HC, STA, CAD1, and CKaD2 groups (A–D). Plots were generated by using GraphPad Prism (Version 9.0.1, GraphPad, La Jolla).
 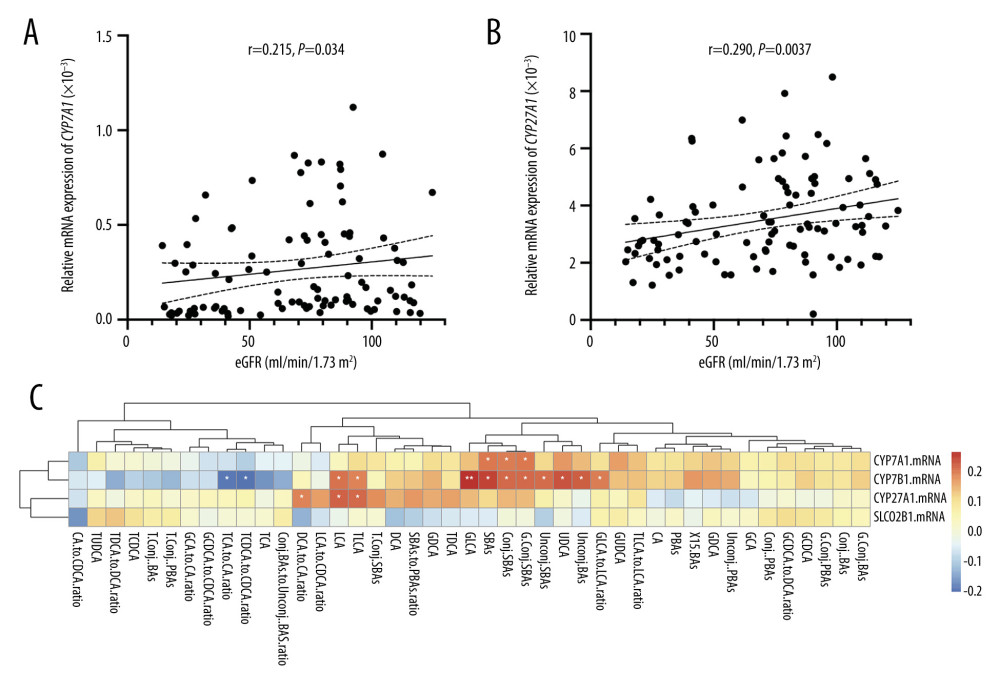 Figure 6. Correlation between relative gene expression of CYP7B1 and CYP27A1 and eGFR levels (A, B). The correlation matrix displays the Spearman correlations between gene expression and BAs species (C). Figure 6A and 6B were generated by using GraphPad Prism (Version 9.0.1, GraphPad, La Jolla). Figure 6C was generated by using R (version 4.2.0, https://cran.r-project.org) and the “corrplot” package was used.
 References
1. Langewisch E, Mannon RB, Chronic allograft injury: Clin J Am Soc Nephrol, 2021; 16(11); 1723-29
2. Lehto M, Groop PH, The gut-kidney axis: Putative interconnections between gastrointestinal and renal disorders: Front Endocrinol (Lausanne), 2018; 9; 553
3. Chen YY, Chen DQ, Chen L, Microbiome-metabolome reveals the contribution of gut-kidney axis on kidney disease: J Transl Med, 2019; 17(1); 5
4. Li R, Zeng L, Xie S, Targeted metabolomics study of serum bile acid profile in patients with end-stage renal disease undergoing hemodialysis: Peer J, 2019; 7; e7145
5. Wang YN, Hu HH, Zhang DD, The dysregulation of eicosanoids and bile acids correlates with impaired kidney function and renal fibrosis in chronic renal failure: Metabolites, 2021; 11(2); 127
6. Javitt N, Bile acid synthesis from cholesterol regulatory and auxiliary pathways: FASEB J, 1994; 8(15); 1308-11
7. Perino A, Demagny H, Velazquez-Villegas L, Schoonjans K, 10. Molecular physiology of bile acid signaling in health, disease, and aging: Physiol Rev, 2021; 101(2); 683-731
8. Schaap FG, Trauner M, Jansen PL, Bile acid receptors as targets for drug development: Nat Rev Gastroenterol Hepatol, 2014; 11(1); 55-67
9. Jennings DL, Bohn B, Zuver A, Gut microbial diversity, inflammation, and oxidative stress are associated with tacrolimus dosing requirements early after heart transplantation: PLoS One, 2020; 15(5); e0233646
10. Lee JR, Muthukumar T, Dadhania D, Gut microbiota and tacrolimus dosing in kidney transplantation: PLoS One, 2015; 10(3); e0122399
11. Souai N, Zidi O, Mosbah A, Impact of the post-transplant period and lifestyle diseases on human gut microbiota in kidney graft recipients: Microorganisms, 2020; 8(11); 1724
12. Lee JR, Muthukumar T, Dadhania D, Gut microbial community structure and complications after kidney transplantation: A pilot study: Transplantation, 2014; 98(7); 697-705
13. Guo C, Xie S, Chi Z, Bile acids control inflammation and metabolic disorder through inhibition of NLRP3 inflammasome: Immunity, 2016; 45(4); 802-16
14. Cai J, Sun L, Gonzalez FJ, 5. Gut microbiota-derived bile acids in intestinal immunity, inflammation, and tumorigenesis: Cell Host Microbe, 2022; 30(3); 289-300
15. Wahlstrom A, Sayin SI, Marschall HU, Backhed F, Intestinal crosstalk between bile acids and microbiota and its impact on host metabolism: Cell Metab, 2016; 24(1); 41-50
16. KDIGO: Kidney Disease Improving Global Outcomes (KDIGO) guidelines https://kdigo.org/
17. MahmoudianDehkordi S, Arnold M, Nho K, Altered bile acid profile associates with cognitive impairment in Alzheimer’s disease – an emerging role for gut microbiome: Alzheimers Dement, 2019; 15(1); 76-92
18. Zhou Y, Ye D, Yuan X, Serum bile acid profiles in latent autoimmune diabetes in adults and type 2 diabetes patients: J Diabetes Res, 2022; 2022; 2391188
19. Shannon P, Markiel A, Ozier O, Cytoscape: A software environment for integrated models of biomolecular interaction networks: Genome Res, 2003; 13(11); 2498-504
20. Cohen E, Korah M, Callender G, Metabolic disorders with kidney transplant: Clin J Am Soc Nephrol, 2020; 15(5); 732-42
21. Piotti G, Gandolfini I, Palmisano A, Maggiore U, Metabolic risk profile in kidney transplant candidates and recipients: Nephrol Dial Transplant, 2019; 34(3); 388-400
22. Qi L, Tian Y, Chen Y, Circulating bile acid profiles: A need for further examination: J Clin Endocrinol Metab, 2021; 106(11); 3093-112
23. Guan B, Tong J, Hao H, Bile acid coordinates microbiota homeostasis and systemic immunometabolism in cardiometabolic diseases: Acta Pharm Sin B, 2022; 12(5); 2129-49
24. Sinha SR, Haileselassie Y, Nguyen LP, Dysbiosis-induced secondary bile acid deficiency promotes intestinal inflammation: Cell Host Microbe, 2020; 27(4); 659-70e5
25. Wang J, Li X, Wu X, Gut microbiota alterations associated with antibody-mediated rejection after kidney transplantation: Appl Microbiol Biotechnol, 2021; 105(6); 2473-84
26. Wu H, Singer J, Kwan TK, Gut microbial metabolites induce donor-specific tolerance of kidney allografts through induction of T regulatory cells by short-chain fatty acids: J Am Soc Nephrol, 2020; 31(7); 1445-61
27. Lee JR, Magruder M, Zhang L, Gut microbiota dysbiosis and diarrhea in kidney transplant recipients: Am J Transplant, 2019; 19(2); 488-500
28. Hu MM, He WR, Gao P, Virus-induced accumulation of intracellular bile acids activates the TGR5-beta-arrestin-SRC axis to enable innate antiviral immunity: Cell Res, 2019; 29(3); 193-205
Figures
 Figure 1. Comparison of BA profiling, composition, and absolute concentrations of individual BAs among HC, STA, CAD1, and CAD2 groups. (A) Supervised partial least squares-discriminant (PLS-DA) score plot based on 15 BAs. (B) Differences in the composition of BAs in 4 groups. * P<0.05 for the comparison among 4 groups. # P<0.05 for the comparison among the 3 KTR groups. (C) Serum concentrations of individual BAs in 4 groups. ## P<0.008, ### P<0.001, #### P<0.0001 vs HC group. ** P<0.008, *** P<0.001, ***** P<0.0001. Figure 1A was generated in MetaboAnalyst (version 5.0, https://www.metaboanalyst.ca). Figure 1B and 1C were generated using GraphPad Prism (Version 9.0.1, GraphPad, La Jolla).
 Figure 2. The correlation matrix displays the Spearman correlations between individual BAs, BA subgroup concentrations, ratios, and the main laboratory indicators. The plot was generated using R (version 4.2.0, https://cran.r-project.org) and “corrplot” package.
 Figure 3. Differential correlation analyses of various BAs between HC and KTR groups. Network analysis illustrates the differential correlation of BAs between study groups (A–C). Only BA pairs with significant differential correlations (P<0.05) were included. The colored lines connecting BAs indicates the direction and strength of the correlation groups, and the number of lines that follows indicates the number of BA pairs in the global networks exhibiting this pattern of change. For instance, the red line +/0 1 in Figure 3A indicates that the correlation between GCA and GDCA was positive (+) in the HC group, but the correlation disappeared (0) in the STA group. Only 1 BA pair connected by red line in the network displayed this pattern of change (+/0). +P<0.05, ++P<0.01, are positively correlated; −P<0.05, is negatively correlated; 0, represents unrelated. Differential correlation coefficients between BA pairs were calculated with the “DGCA” package and the visualization of correlation networks were achieved using Cytoscape software (Version 3.7.2).
 Figure 4. Differential correlation analyses of various BAs between KTR groups. Network analysis illustrates the differential correlation of BAs between the 3 KTR groups (A–C).
 Figure 5. Relative gene expressions of CYP7A1, CYP7B1, CYP27A1, and SLCO2B1 in the peripheral blood of HC, STA, CAD1, and CKaD2 groups (A–D). Plots were generated by using GraphPad Prism (Version 9.0.1, GraphPad, La Jolla).
 Figure 6. Correlation between relative gene expression of CYP7B1 and CYP27A1 and eGFR levels (A, B). The correlation matrix displays the Spearman correlations between gene expression and BAs species (C). Figure 6A and 6B were generated by using GraphPad Prism (Version 9.0.1, GraphPad, La Jolla). Figure 6C was generated by using R (version 4.2.0, https://cran.r-project.org) and the “corrplot” package was used.
 Tables
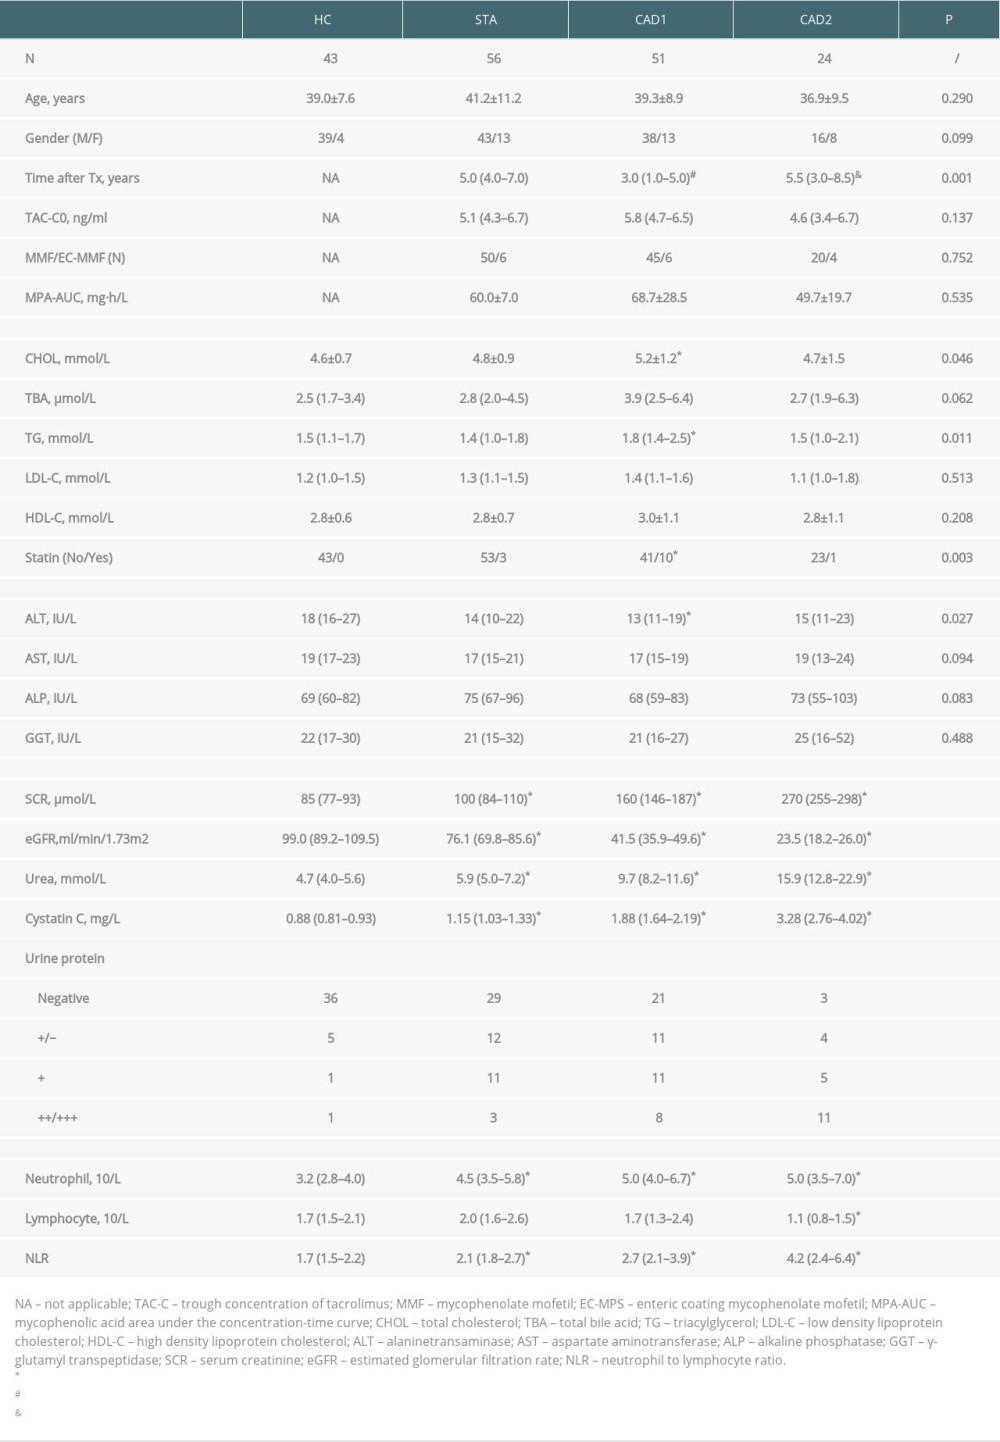 Table 1. Characteristics of study participants.
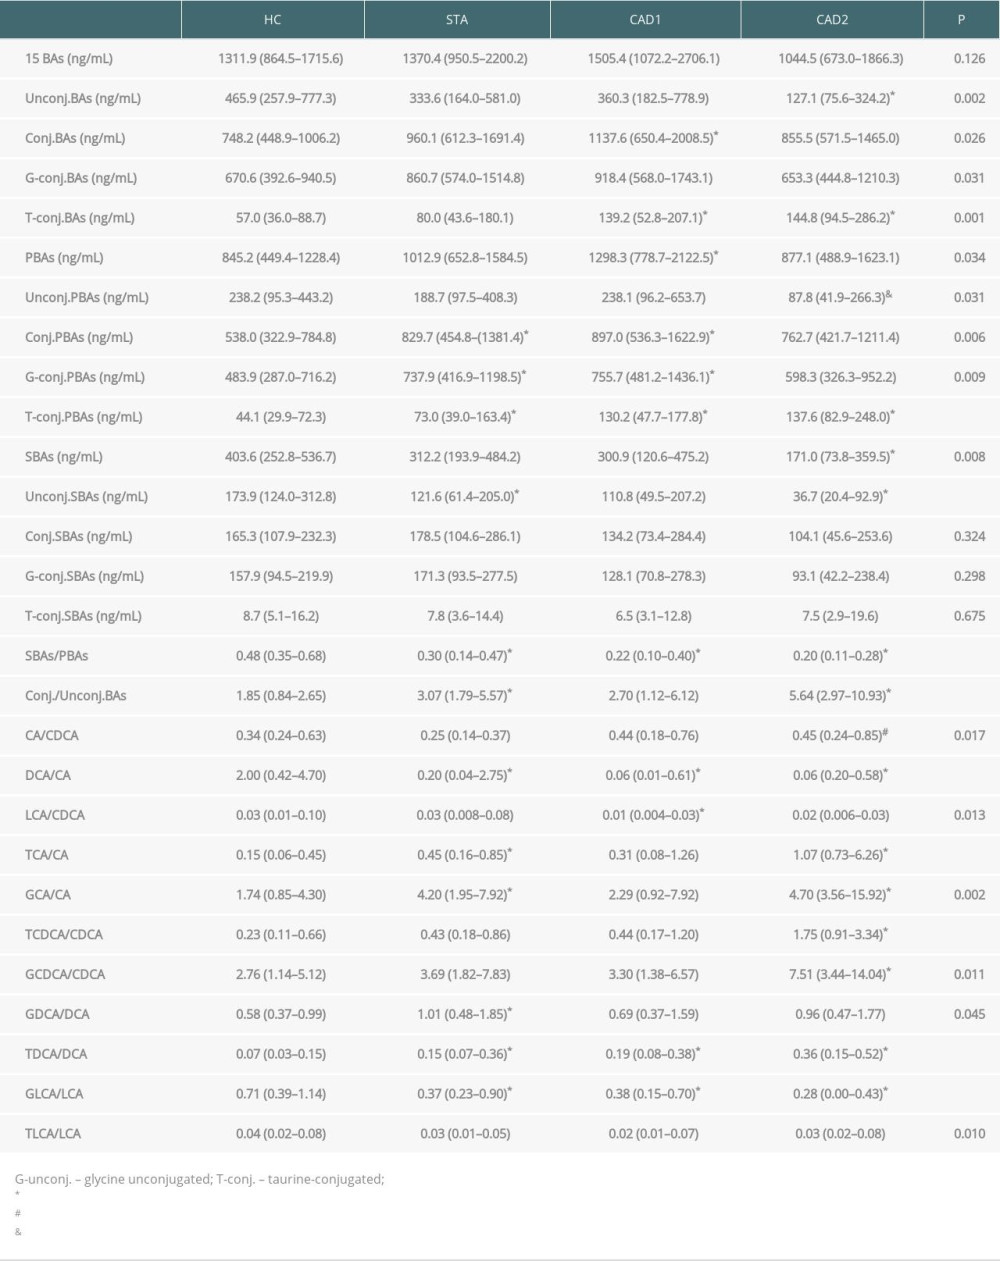 Table 2. Serum BAs subgroup concentrations and ratios in HCs and KTRs with different allograft function.
 Table 1. Characteristics of study participants.
 Table 2. Serum BAs subgroup concentrations and ratios in HCs and KTRs with different allograft function.
 In Press
18 Mar 2024 : Original article
Does Antibiotic Use Increase the Risk of Post-Transplantation Diabetes Mellitus? A Retrospective Study of R...Ann Transplant In Press; DOI: 10.12659/AOT.943282
20 Mar 2024 : Original article
Transplant Nephrectomy: A Comparative Study of Timing and Techniques in a Single InstitutionAnn Transplant In Press; DOI: 10.12659/AOT.942252
28 Mar 2024 : Original article
Association Between FEV₁ Decline Rate and Mortality in Long-Term Follow-Up of a 21-Patient Pilot Clinical T...Ann Transplant In Press; DOI: 10.12659/AOT.942823
02 Apr 2024 : Original article
Liver Transplantation from Brain-Dead Donors with Hepatitis B or C in South Korea: A 2014-2020 Korean Organ...Ann Transplant In Press; DOI: 10.12659/AOT.943588
Most Viewed Current Articles
05 Apr 2022 : Original article
Impact of Statins on Hepatocellular Carcinoma Recurrence After Living-Donor Liver TransplantationDOI :10.12659/AOT.935604
Ann Transplant 2022; 27:e935604
12 Jan 2022 : Original article
Risk Factors for Developing BK Virus-Associated Nephropathy: A Single-Center Retrospective Cohort Study of ...DOI :10.12659/AOT.934738
Ann Transplant 2022; 27:e934738
22 Nov 2022 : Original article
Long-Term Effects of Everolimus-Facilitated Tacrolimus Reduction in Living-Donor Liver Transplant Recipient...DOI :10.12659/AOT.937988
Ann Transplant 2022; 27:e937988
15 Mar 2022 : Case report
Combined Liver, Pancreas-Duodenum, and Kidney Transplantation for Patients with Hepatitis B Cirrhosis, Urem...DOI :10.12659/AOT.935860
Ann Transplant 2022; 27:e935860


