21 June 2022: Original Paper
Vitamin D Metabolites, Body Composition, and Nutritional Status in Patients in the Long Term After Kidney Transplantation
Patrycja GrzejszczakDOI: 10.12659/AOT.936009
Ann Transplant 2022; 27:e936009


Abstract
BACKGROUND: The aim of the study was to assess the relationship between body composition and nutritional status with the level of vitamin D metabolites 25(OH)D and 1,25(OH)₂D in patients in the long term after kidney transplantation (KTx).
MATERIAL AND METHODS: During 2 routine outpatient visits in summer and winter, the anthropometric and body composition measurements and laboratory data from 105 stable KTx patients were taken and the annual averages were analyzed.
RESULTS: Data of 64 patients (26 F, 38 M) at mean age 49.3±12.2 years and 5.6±2.7 years after KTx with mean BMI 26.9 kg/m² were included for final analysis. Mean annual 25(OH)D concentration was 18.76±6.32 ng/dl and 1,25(OH)₂D 86.65±18.0 pg/ml. A reverse relationship between 25(OH)D level and fat tissue index was observed (r=-0.26; P=0.039). 25(OH)D level increased together with body cell mass (r=0.30, P=0.017) and lean tissue mass values (r=0.30, P=0.015). The body weight and BMI were not associated with 25(OH)D or 1,25(OH)₂D level. A reverse relationship was found between: 25(OH)D and total cholesterol (r=-0.31, P=0.012) and LDL level (r=-0.25, P=0.049), and between 1,25(OH)₂D and HDL level (r=-0.25, P=0.046). No significant correlations between biochemical nutritional parameters, graft function and 25(OH)D or 1,25(OH)2D were noted.
CONCLUSIONS: Body composition is one of the factors affecting the vitamin D status in KTx patients. Fat tissue index is a negative predictor of 25(OH)D level in patients in the long term after KTx. A low level of 25(OH)D predisposes to lipids disturbances in KTx recipients.
Keywords: Body Composition, Calcitriol, Kidney Transplantation, Nutritional Status, Adult, Body Mass Index, Humans, Middle Aged, Vitamin D, Vitamin D Deficiency
Background
The main sources of biologically inactive vitamin D are its skin synthesis due to UVB [1] radiation and its ingestion with diet [2]. Activation of vitamin D occurs during the two-step hydroxylation: first in the liver, where 25-hydroxylase produces 25(OH)D and second in the kidney’s proximal tubular cells, where 1α-hydroxylase actives it to 1,25(OH)2D (calcitriol), although this hydroxylation also may appear in other tissues and organs [3]. One of the extrarenal sources of 1,25(OH)2D is adipose tissue (subcutaneous and visceral), which contains specific enzymes with 25-hydroxylase activity (CYP2R1, CYP2J2, and CYP27A1) [3]. Adipose tissue is also responsible for vitamin D storage [4] and expression of vitamin D receptor (VDR) [5,6]. After binding with VDR, 1,25(OH)2D regulates gene and hormone expression of leptin, insulin sensitizing hormone, and adiponectin [6] and therefore body composition, mainly fat tissue content, can influence vitamin D status. Some studies found that obesity, defined by body mass index (BMI), is associated with lower 25(OH)D levels [7–9]. Vitamin D deficiency or insufficiency is common in the general population [10] and in kidney transplantation (KTx) patients [11]. Nevertheless, kidney recipients are exposed to additional risk factors of vitamin D insufficiency such as decreased graft function, dietary restrictions, recommendations to avoid sun exposure with its increased probability of developing skin cancer, immunosuppressive drugs use including steroids, and calcineurin inhibitors influencing vitamin D catabolism or possible urine void-related loss of vitamin D proteins binder [12–14]. However, some studies showed no relationship between graft function and vitamin D status [11,15], which suggests that other factors determine vitamin D levels in this population. A growing number of studies document an increase of BMI and fat tissue content in most patients after KTx [11,16].
The aim of this study was to investigate the relationships of 25(OH)D and 1,25(OH)2D levels with body composition and nutritional status in patients in the long term after KTx.
Material and Methods
We included 105 patients (42 F, 63 M, mean age 49.33±12.17 years) in a long term after KTx with stable graft function, living in Poland (at the latitude 51°46′N 19°27′E). They underwent KTx from a deceased donor between 2004 and 2013 and had been under the care of the outpatient post-transplant clinic. All gave their consent to participate in the study. The Bioethics Commission approved the protocol.
The inclusion criteria were as follows: patients over 12 months after KTx, stable graft function during last 6 months (changes in estimated glomerular filtration rate (eGFR) below 5 ml/min/1.73 m2), with immunosuppressive regimen consisting of a low-dose prednisone (5.0±2.5 mg/d) with calcineurin inhibitor: cyclosporin (CsA) or tacrolimus (TAC) and mycophenolate mofetil (MMF) or sodium (MPS).
The exclusion criteria were as follows: supplementation with any of vitamin D compounds (ergocalciferol, cholecalciferol, alphacalcidol, or calcitriol), calcium or cinacalcet treatment during last 6 months, any pharmacological treatment for osteopenia or osteoporosis, severe hypocalcemia or hypercalcemia, uncontrolled hyperparathyroidism, history of any cancer, acute conditions including infection during the last month, diseases preventing active movement, and travel associated with increased sunlight exposure in the previous 6 months.
The study was based on 2 visits: first in summer (August, September) and second in winter (January, February). On both visits height, body weight, and body composition measurements (BCM) were performed. BCM was done using electrical bioimpedance body composition monitoring by Fresenius Medical Care BCM (Bad Homburg von der Hohe, Germany); the reference range was compared to parameters available on the manufacturer’s website. BCM parameters were measured: fat mass (FAT), fat tissue index (FTI), adipose tissue mass (ATM), lean tissue mass (LTM), lean tissue index (LTI), body cell mass (BCM), total body water (TBW), intracellular water (ICW), and extracellular water (ECW).
Fasting blood samples were collected during the same routine ambulatory visits: serum creatinine, albumin, total protein, glucose, CRP, total cholesterol (TC), HDL cholesterol, triglycerides (TG), (LDL-cholesterol calculated using the Friedewald formula), parameters of calcium-phosphate metabolism: parathyroid hormone (PTH), calcium and phosphorus, blood count, and concentration of TAC/CsA before the next dose of the drug. Blood samples were centrifuged and frozen at −80°C to assess the level of 25(OH)D, calcitriol, and fibroblast growth factor 23 (FGF-23). The albumin/creatinine ratio (ACR) in the first morning urine collection was also determined on the same visits. 25(OH)D was measured with enzyme-linked immunosorbent assay (ELISA) (25-OH Vitamin D total; Demeditec; Kiel-Wellsee, Germany), calcitriol (ELISA kit for calcitriol; Wuhan, China) and FGF-23 (ELISA kit for FGF-23; Wuhan EIAab Science; Wuhan, China). Graft function was determined by assessing eGFR calculated on the basis of a simplified MDRD formula (The Modification of Diet in Renal Disease). Vitamin D status was determined by 25(OH)D level based on the KDIGO guidelines and was described as: sufficient >30 ng/mL, insufficient 15–30 ng/mL, and deficiency <15 ng/mL [17]. BMI values were further set into 4 categories in line with the World Health Organization guidelines: low <18.5 kg/m2, normal 18.5–24.9 kg/m2, overweight 25.0–29.9 kg/m2, and obesity over 30 kg/m2. For abnormal lipid levels we assumed: TC >190 mg/dl, TG >150 mg/dl. For statistical analysis, IBM SPSS program was used. Normal distribution was tested by Shapiro-Wilk test. The correlation between 2 quantitative parameters was measured with Pearson correlation coefficient (for normal distribution) or Spearman correlation coefficient (without normal distribution). Differences between parameters for 2 independent groups were evaluated by the
Results
In this prospective observational study, 64 adult patients (26 F, 38 M) at mean age 49.3±12.2 years (range 20–72 years) and 5.6±2.7 years (range 2–16 years) after KTx, dialyzed for 2.24±0.32 years (range 0.5–3.9 years) prior to surgery were finally included into the analysis. We disqualified 41 patients out of 105 originally included: 15 patients because of missing follow-up visits, 18 patients because of presence of active inflammation on a follow-up visit, 7 patients started supplementation of vitamin D or calcium, and 1 patient changed transplant clinic. The causes of end-stage kidney disease were: glomerulonephritis (n=24), cystic degeneration of the kidneys (n=11), chronic interstitial nephritis (n=6), reflux nephropathy (n=4), diabetic nephropathy (n=3), and idiopathic reasons (n=16).
Mean annual level of 25(OH)D was 18.76±6.32 ng/dl and of 1,25(OH)2D was 86.65±18.0 pg/ml. Mean levels of both metabolites in summer were significantly higher than during winter. Tests performed in winter showed higher HDL cholesterol, but the other parameters of lipid metabolism did not show a seasonal relationship. Lower concentrations of total protein in winter were noted, but both total protein and albumin levels were within laboratory norms. The laboratory data including vitamin D metabolites levels, graft function, serum albumin and protein levels, lipids, and ACR are presented in Table 1.
The seasonal anthropometric data and body composition parameters are presented in Table 2. The winter measurements of weight and BMI were significantly higher than in summer. Likewise, during winter significantly higher FTI, FAT, and ATM levels were observed. LTM, LTI, and BCM levels were significantly lower. No significant differences between anthropometric and biochemical parameters were found among groups with deficiency, insufficiency, and normal 25(OH)D level, except that the height of patients was positively associated with vitamin D level: 167.69±7.02 cm, 168.43±8.87, cm and 179.5±8.58 cm;
We observed an inverse association between parameters of body fat content and 25(OH)D concentrations: patients in FTI <90 percentile had a statistically higher 25(OH)D level than those with FTI >90 percentile (22.15±8.17 vs 17.89±5.53 kg/m2;
Patients with sufficient vitamin D content had a lower TC level in comparison to patients with 25(OH)D <30 ng/ml (171.63±34.87 vs 216.03±39.61 mg/dl;
No other significant differences in biochemical parameters (including graft function parameters, mineral parameters, ie, PTH and FGF-23, and albuminuria) were found between patients with a normal vs insufficient level of vitamin D
Multiple logistic regression analysis was performed to identify factors affecting the vitamin D metabolite levels. The model of prediction of 25(OH)D level was built with 10 variables out of 16 proposed. All of the variables were significant and are presented in Table 4. Such a model could not be built for 1,25(OH)2D.
Discussion
One study showed that most of KTx patients in Poland have vitamin D deficiency, independent of graft function [11]. There are many other factors that can affect vitamin D status in the KTx population. Both lack of vitamin D [11,13,18] and obesity [19,20] are features frequently observed among KTx recipients. There are few reports that analyzed active vitamin D metabolites levels in relation to body composition, especially in chronic kidney disease (CKD) patients and even fewer in those after KTx. Considering the important role of fat tissue in the vitamin D metabolism, in our study we undertook to analyze the association of body composition and nutritional status with vitamin D metabolite levels in this population. We found that with an increase in body fat volume, the 25(OH)D level decreases, while lean body mass content has a positive effect on this hormone. We did not observe such a phenomenon in relation to 1,25(OH)2D level. Furthermore, neither body weight nor BMI in our patients were associated with 25(OH)D or 1,25(OH)2D level. However, the BMI value was found to be one of the factors affecting the 25(OH)D level in linear regression analysis.
The data regarding the relationship between BMI and 25(OH)D in CKD patients [21] including KTx recipients [22] are ambiguous. Most studies on the general population show a reverse correlation between BMI and 25(OH)D level [23,24]. Figuiredo-Dias et al found lower 25(OH)D level with rising BMI among non-dialyzed CKD patients in stages 2–5 [25], which corresponds with the results of our study. Similar to our results, the authors found no correlation between vitamin D levels and GFR [25]. Obesity is commonly diagnosed based on BMI value in the KTx population [11,16,26] and is associated with excess body fat mass [27]. A previous study conducted in our center showed that during the first 3 years following KTx, 65% of patients gained weight, with a mean BMI increase in the whole study population of 0.4±1.3 kg/m2 per year [16]. Lower 25(OH)D level with increasing fat tissue content and BMI in KTx patients was also observed by Baxmann et al [28]. Similar to our observations, the authors show that fat tissue amount and BMI are independent factors affecting 25(OH)D level, but this was not observed for eGFR or proteinuria [28]. Excess fat tissue, particularly indexes of obesity, were found to be strongly associated with vitamin D insufficiency among Brazilians after KTx [29]. They showed that patients with either vitamin D deficiency or insufficiency had significantly higher values of body fat and greater weight gain since transplantation [29].
Our current and previous studies and observations of other researchers seem to suggest that the increase of fat tissue mass and even more so weight gain are important risk factors of vitamin D deficiency in patients in the long term after KTx. Considering that a decrease of fat tissue mass with a concurrent increase in lean tissue mass may improve vitamin D status, the build-up of cellular and muscular mass in order to prevent obesity and fat tissue accumulation by regular physical activity and healthy lifestyle should be recommended.
The mechanism by which obesity affects 25(OH)D levels in KTx patients remains unknown, but limited physical activity with a resulting weight gain and less exposure to the sun are highly probable. Wortsman et al showed that 24 hours after ultraviolet exposure, the increase of vitamin D concentrations was 57% smaller in the obese than in nonobese subjects, but the content of vitamin D in the skin was not significantly different between groups [24]. It is therefore suspected that obesity alters the release of vitamin D from the skin and subcutaneous fat, which is known to store vitamin D and which sequesters more of the cutaneous synthesized vitamin D, into the blood circulation [24]. The higher lipogenesis and reduced lipolysis observed in overweight patients may decrease bioavailability of vitamin D as well [28]. Genetic factors are also considered [23]. Furthermore, some authors suggest a connection between PTH elevation and increased fat tissue volume [30,31]. We observed a tendency to an increase of PTH level and decrease of 25(OH)D in our recipients.
Vitamin D insufficiency is also identified as a risk factor of dyslipidemia, both in the general population [32–34] and in CKD patients [35,36]. Vitamin D increases expression of peroxisome proliferator-activated receptors α (PPAR-α), which play key role in lipids metabolism in hepatocytes [37]. In our study we observed that along with increasing 25(OH)D level, TC and LDL levels decrease, and TC, HDL, and LDL levels were factors affecting 25(OH)D levels in linear regression analysis. We noticed a reverse relationship between calcitriol and HDL level. Data assessing associations between particular components of lipids and vitamin D metabolites are unequivocal – some of them show the relationship, some do not [29,38,39]. However, we must emphasize that most of our patients (73%) had received statin therapy, so the described improvement cannot be assigned only to the beneficial influence of vitamin D. Sikgenc et al showed that vitamin D supplementation in KTx patients decreases TC and TG levels [38]. Keyzer et al showed a positive relationship between 25(OH)D and LDL level and a negative relationship between 25(OH)D and waist circumference and dialysis vintage before KTx [40]. They also identified factors positively influencing 1,25(OH)2D level: 25(OH)D level, eGFR, HDL (reverse correlation in our study), and negatively with transplantation vintage. In our study the linear model for 1,25(OH)2D could not be built. Considering this and the lack of correlation between 1,25(OH)2D and 25(OH)D, it can be assumed that other factors and relationships affect their level, in which one or more variables are not in linear dependence. Based on these data, it can be presumed that body composition affects vitamin D metabolism in KTx patients, but vitamin D affects the lipid profile, although determining the exact dependence requires further studies in larger populations. Lack of assessment of the thyroid hormones profile, which can affect the lipids profile and nutrition markers, is a limitation of our study. We did not observe any relationship between vitamin D metabolite levels and serum levels of total protein or albumin as markers of nutrition, but none of our recipients showed laboratory markers of malnutrition. FGF-23 suppresses the activity of 1α-hydroxylase and escalates the activity of 24-hydroxylase of vitamin D in the proximal tubule, which results in the reduction of concentration of active vitamin D metabolites [41]. The higher levels of FGF-23 observed in our patients in winter may be also one of the factors resulting in lower levels of active vitamin D metabolites.
As far as we know, our study is the first to present correlations between body composition and nutrition with 25(OH)D or 1,25(OH)2D in KTx patients in Central Europe. However, there were limitations to this study, including a small sample size from a single center and shortage of precise data about changes in patient weight from the moment of KTx to our measurements. Due to the small group size of patients and statin intake by most of them, we did not divide the population into treated/non-treated with statins to evaluate the relationships between lipid concentrations and vitamin D metabolites. A strength of our study is its complex evaluation of all assessed parameters at 2 time points, during summer and winter, and taking under consideration the average of those 2 measurements, which eliminates the influence of season on vitamin D metabolites.
Conclusions
Body composition is one of the factors affecting vitamin D status in KTx patients
Tables
Table 1. Annual and seasonal levels of vitamin D metabolites, biochemical parameters and urine albumin/creatine ratio in patients in long term after kidney transplantation.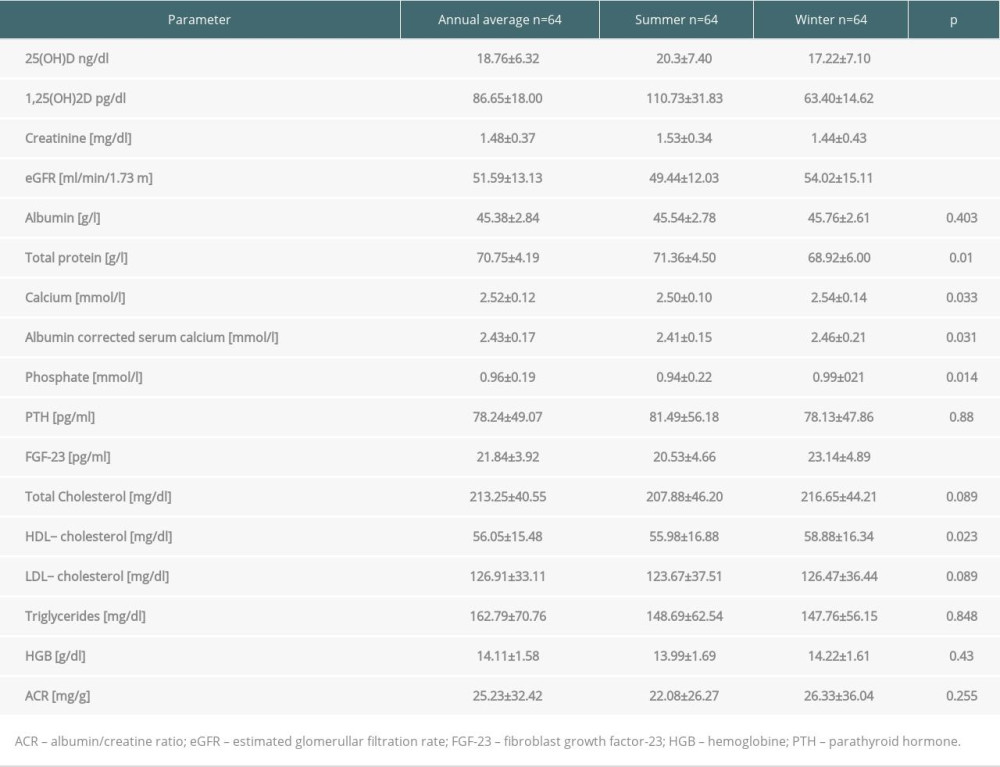 Table 2. Anthropometric data and body composition parameters in kidney recipients in summer and winter.
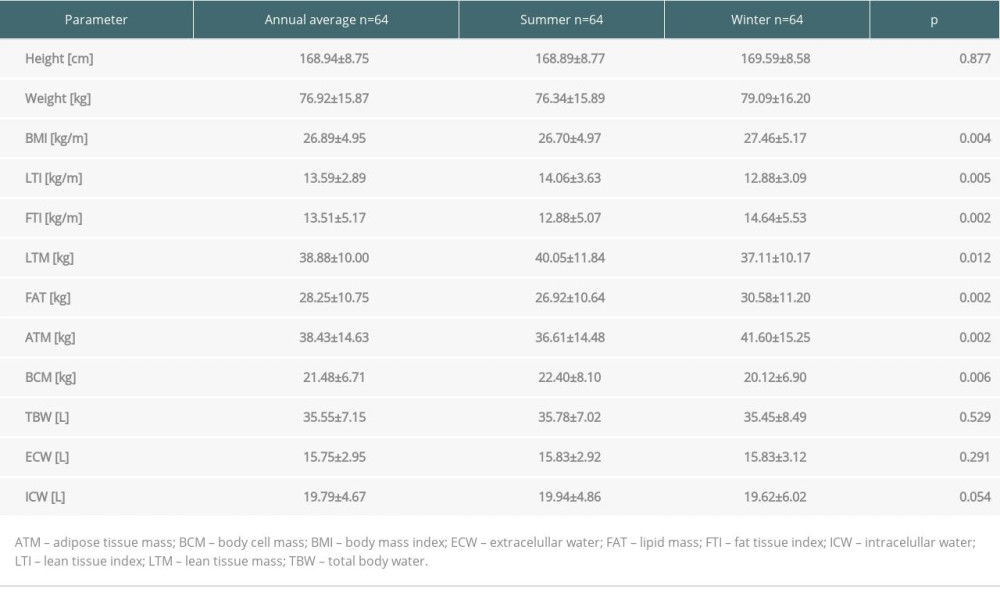 Table 3. Body composition parameters in kidney recipients according to 25(OH)D level.
 Table 4. Predictors of 25(OH)D level in multivariate logistic regression analysis in patients in the long term after kidney transplantation.
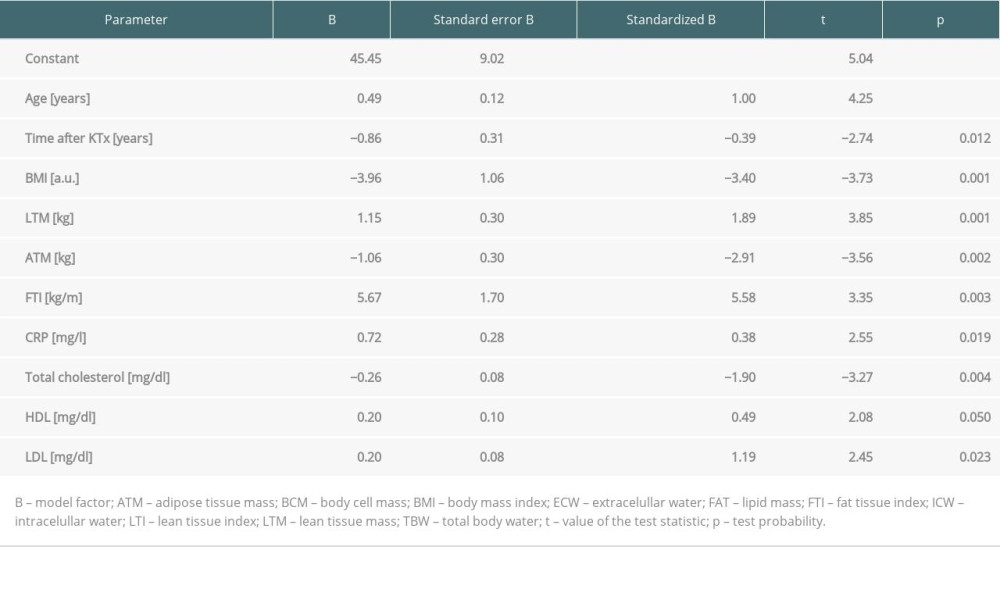
References
1. Holick MF, MacLaughlin JA, Clark MB, Photosynthesis of previtamin D3 in human skin and the physiologic consequences: Science (New York, NY), 1980; 210(4466); 203-5
2. Calvo MS, Whiting SJ, Barton CN, Vitamin D intake: A global perspective of current status: J Nutr, 2005; 135(2); 310-16
3. Bikle DD, Vitamin D metabolism, mechanism of action, and clinical applications: Chem Biol, 2014; 21(3); 319-29
4. Rosenstreich SJ, Rich C, Volwiler W, Deposition in and release of vitamin D3 from body fat: Evidence for a storage site in the rat: J Clin Invest, 1971; 50(3); 679-87
5. Ching S, Kashinkunti S, Niehaus MD, Zinser GM, Mammary adipocytes bioactivate 25-hydroxyvitamin D3 and signal via vitamin D3 receptor, modulating mammary epithelial cell growth: J Cell Biochem, 2011; 112(11); 3393-405
6. Abbas MA, Physiological functions of Vitamin D in adipose tissue: J Steroid Biochem Mol Biol, 2017; 165; 369-81
7. Lagunova Z, Porojnicu AC, Lindberg F, The dependency of vitamin D status on body mass index, gender, age and season: Anticancer Res, 2009; 29(9); 3713-20
8. Vanlint S, Vitamin D and obesity: Nutrients, 2013; 5(3); 949-56
9. Walsh JS, Bowles S, Evans AL, Vitamin D in obesity: Curr Opin Endocrinol Diabetes Obes, 2017; 24(6); 389-94
10. Cashman KD, Dowling KG, Škrabáková Z, Vitamin D deficiency in Europe: Pandemic?: Am J Clin Nutr, 2016; 103(4); 1033-44
11. Wilimborek J, Nowicki M, Kurnatowska I, Seasonal variation of vitamin D status in long-term kidney transplant recipients: Transplant Proc, 2017; 49(9); 2086-91
12. de Borst MH, Hajhosseiny R, Tamez H, Active vitamin D treatment for reduction of residual proteinuria: A systematic review: J Am Soc Nephrol, 2013; 24(11); 1863-71
13. Stavroulopoulos A, Cassidy MJD, Porter CJ, Vitamin D status in renal transplant recipients: Am J Transplant, 2007; 7(11); 2546-52
14. Stein EM, Shane E, Vitamin D in organ transplantation: Osteoporos Int, 2011; 22(7); 2107-18
15. Marcén R, Ponte B, Rodríguez-Mendiola N, Vitamin D deficiency in kidney transplant recipients: Risk factors and effects of vitamin D3 supplements: Transplant Proc, 2009; 41(6); 2388-90
16. Kurnatowska I, Małyska A, Wysocka K, Long-term effect of body mass index changes on graft damage markers in patients after kidney transplantation: Ann Transplant, 2016; 21; 626-31
17. , KDIGO clinical practice guideline for the diagnosis, evaluation, prevention, and treatment of Chronic Kidney Disease-Mineral Bone Disorder (CKD-MBD): Kidney Int Suppl, 2009; 113; S1-130
18. Ewers B, Gasbjerg A, Moelgaard C, Vitamin D status in kidney transplant patients: need for intensified routine supplementation: Am J Clin Nutr, 2008; 87(2); 431-37
19. Friedman AN, Obesity in patients undergoing dialysis and kidney transplantation: Adv Chronic Kidney Dis, 2013; 20(2); 128-34
20. Potluri K, Hou S, Obesity in kidney transplant recipients and candidates: Am J Kidney Dis, 2010; 56(1); 143-56
21. Restrepo Valencia CA, Aguirre Arango JV, Vitamin D (25(OH)D) in patients with chronic kidney disease stages 2–5: Colomb Med (Cali), 2016; 47(3); 160-66
22. Argentino ACB, Souza JF, dos Santos Sens YA, Evaluation of the anthropometric clinical measurements and Vitamin D status in kidney transplant recipients: Comparison between sexes: Saudi J Kidney Dis Transpl, 2019; 30(1); 24-32
23. Ruiz-Ojeda FJ, Anguita-Ruiz A, Leis R, Aguilera CM, Genetic factors and molecular mechanisms of vitamin D and obesity relationship: Ann Nutr Metab, 2018; 73(2); 89-99
24. Wortsman J, Matsuoka LY, Chen TC, Decreased bioavailability of vitamin D in obesity: Am J Clin Nutr, 2000; 72(3); 690-93
25. Figuiredo-Dias V, Cuppari L, Garcia-Lopes MG, Risk factors for hypovitaminosis D in nondialyzed chronic kidney disease patients: J Ren Nutr, 2012; 22(1); 4-11
26. Nöhre M, Schieffer E, Hanke A, Obesity after kidney transplantation-results of a KTx360° substudy: Front Psychiatry, 2020; 11; 399
27. Pantik C, Cho Y-E, Hathaway D, Characterization of body composition and fat mass distribution 1 year after kidney transplantation: Prog Transplant, 2017; 27(1); 10-15
28. Baxmann AC, Menon VB, Medina-Pestana JO, Overweight and body fat are predictors of hypovitaminosis D in renal transplant patients: Clin Kidney J, 2015; 8(1); 49-53
29. Rosina KTC, Menna Barreto APM, Pontes KSS, Vitamin D status in renal transplant recipients living in a low-latitude city: Association with body fat, cardiovascular risk factors, estimated glomerular filtration rate and proteinuria: Br J Nutr, 2017; 117(9); 1279-90
30. Frost M, Abrahamsen B, Nielsen TL, Vitamin D status and PTH in young men: A cross-sectional study on associations with bone mineral density, body composition and glucose metabolism: Clin Endocrinol (Oxf), 2010; 73(5); 573-80
31. Alemzadeh R, Kichler J, Babar G, Calhoun M, Hypovitaminosis D in obese children and adolescents: Relationship with adiposity, insulin sensitivity, ethnicity, and season: Metabolism, 2008; 57(2); 183-91
32. Wang Y, Si S, Liu J, The associations of serum lipids with vitamin D status: PLoS One, 2016; 11(10); e0165157
33. Lupton JR, Faridi KF, Martin SS, Deficient serum 25-hydroxyvitamin D is associated with an atherogenic lipid profile: The Very Large Database of Lipids (VLDL-3) study: J Clin Lipidol, 2016; 10(1); 72-81e1
34. Yarparvar A, Elmadfa I, Djazayery A, The association of vitamin D status with lipid profile and inflammation biomarkers in healthy adolescents: Nutrients, 2020; 12(2); 590
35. Ahmadi F, Damghani S, Lessan-Pezeshki M, Association of low vitamin D levels with metabolic syndrome in hemodialysis patients: Hemodial Int, 2016; 20(2); 261-69
36. Milajerdi A, Ostadmohammadi V, Amirjani S, The effects of vitamin D treatment on glycemic control, serum lipid profiles, and C-reactive protein in patients with chronic kidney disease: A systematic review and meta-analysis of randomized controlled trials: Int Urol Nephrol, 2019; 51(9); 1567-80
37. Ning C, Liu L, Lv G, Lipid metabolism and inflammation modulated by Vitamin D in liver of diabetic rats: Lipids Health Dis, 2015; 14; 31
38. Sikgenc MM, Paydas S, Balal M, Bone disease in renal transplantation and pleotropic effects of vitamin D therapy: Transplant Proc, 2010; 42(7); 2518-26
39. Thorsen IS, Bleskestad IH, Åsberg A, Vitamin D as a risk factor for patient survival after kidney transplantation: A prospective observational cohort study: Clin Transplant, 2019; 33(5); e13517
40. Keyzer CA, Riphagen IJ, Joosten MM, Associations of 25(OH) and 1,25(OH)2 vitamin D with long-term outcomes in stable renal transplant recipients: J Clin Endocrinol Metab, 2015; 100(1); 81-89
41. Perwad F, Zhang MY, Tenenhouse HS, Portale AA, Fibroblast growth factor 23 impairs phosphorus and vitamin D metabolism in vivo and suppresses 25-hydroxyvitamin D-1alpha-hydroxylase expression in vitro: Am J Physiol Renal Physiol, 2007; 293(5); F1577-83
Tables
Table 1. Annual and seasonal levels of vitamin D metabolites, biochemical parameters and urine albumin/creatine ratio in patients in long term after kidney transplantation.Table 2. Anthropometric data and body composition parameters in kidney recipients in summer and winter.Table 3. Body composition parameters in kidney recipients according to 25(OH)D level.Table 4. Predictors of 25(OH)D level in multivariate logistic regression analysis in patients in the long term after kidney transplantation. In Press
18 Mar 2024 : Original article
Does Antibiotic Use Increase the Risk of Post-Transplantation Diabetes Mellitus? A Retrospective Study of R...Ann Transplant In Press; DOI: 10.12659/AOT.943282
20 Mar 2024 : Original article
Transplant Nephrectomy: A Comparative Study of Timing and Techniques in a Single InstitutionAnn Transplant In Press; DOI: 10.12659/AOT.942252
28 Mar 2024 : Original article
Association Between FEV₁ Decline Rate and Mortality in Long-Term Follow-Up of a 21-Patient Pilot Clinical T...Ann Transplant In Press; DOI: 10.12659/AOT.942823
02 Apr 2024 : Original article
Liver Transplantation from Brain-Dead Donors with Hepatitis B or C in South Korea: A 2014-2020 Korean Organ...Ann Transplant In Press; DOI: 10.12659/AOT.943588
Most Viewed Current Articles
05 Apr 2022 : Original article
Impact of Statins on Hepatocellular Carcinoma Recurrence After Living-Donor Liver TransplantationDOI :10.12659/AOT.935604
Ann Transplant 2022; 27:e935604
12 Jan 2022 : Original article
Risk Factors for Developing BK Virus-Associated Nephropathy: A Single-Center Retrospective Cohort Study of ...DOI :10.12659/AOT.934738
Ann Transplant 2022; 27:e934738
22 Nov 2022 : Original article
Long-Term Effects of Everolimus-Facilitated Tacrolimus Reduction in Living-Donor Liver Transplant Recipient...DOI :10.12659/AOT.937988
Ann Transplant 2022; 27:e937988
15 Mar 2022 : Case report
Combined Liver, Pancreas-Duodenum, and Kidney Transplantation for Patients with Hepatitis B Cirrhosis, Urem...DOI :10.12659/AOT.935860
Ann Transplant 2022; 27:e935860