26 August 2022: Original Paper
Development of a Novel Model for Predicting Postoperative Short-Term Outcome in Patients with Hepatitis B-Related Acute-on-Chronic Liver Failure Undergoing Liver Transplantation
Qikun Zhang12ABCDEF*, Menglong Wang2ADF, Guangming Li2BDG, Zhongtao Zhang1ADEDOI: 10.12659/AOT.936732
Ann Transplant 2022; 27:e936732


Abstract
BACKGROUND: We aimed to create a novel predictive model through comparing the prognostic accuracy of the current mainstream scoring models in predicting the short-term outcome of patients with hepatitis B-related acute-on-chronic liver failure (HBACLF) undergoing liver transplantation (LT).
MATERIAL AND METHODS: Data on patients with HBACLF undergoing LT were retrospectively collected and analyzed. The area under the time-dependent receiver operating characteristic curve of 16 scoring models was calculated to evaluate their performance in predicting short-term survival after LT. Univariate analyses and LASSO regression were used to identify the independent variables, which were further selected by Cox stepwise regression.
RESULTS: A total of 135 patients were enrolled. Among the 16 scoring models, MELD-Na performed the best in predicting 3-month mortality after LT, with an AUC of 0.716. LASSO regression analysis revealed that only the MELD-Na was confirmed as an independent predictor (HR 1.0481, 95% C.I [1.0136, 1.0838], P<0.05). Cox stepwise regression identified 4 variables – MELD-Na, sex, systemic infection, and placement of T-tube during operation – which were used to construct a novel prognostic model with a C-index of 0.844 and a Brier score of 0.131 after internal validation and a C-index of 0.824 (95% C.I [0.658, 0.989]) and a Brier score of 0.119 in the external validation cohort at 3 months.
CONCLUSIONS: Compared with other scoring models, MELD-Na was an independent factor in predicting short-term outcome after LT. The constructed novel predictive model could exert clinical benefits on early prognostic assessment and case selection.
Keywords: Acute-On-Chronic Liver Failure, Liver Transplantation, Patient Outcome Assessment, Predictive Value of Tests, Hepatitis B, Humans, ROC Curve, Sodium
Background
Acute-on-chronic liver failure (ACLF) is an independent syndrome distinguished from decompensated liver cirrhosis. It is mainly characterized by progressive deterioration of liver function and high 28-day mortality [1]. The definition of ACLF by the Asian-Pacific Association for the Study of the Liver (APASL) focused on the failure of the liver itself, which was different from that by the AASLD (American Association for the Study of Liver Diseases) or EASL (European Association for the Study of the Liver) [2,3]. Although Eastern countries and Western countries have some different definitions for ACLF, the common focus is on risk stratification and prognosis assessment.
HBACLF, reflecting the most severely ill status of patients, is the most common type of liver failure in China. In-depth research on the perioperative period of transplantation can help explore efficient prognostic models and reduce futile transplantation. Advances in surgical techniques and critical care have decreased the early mortality after LT in the past decades. However, health-care costs related to LT continue to rise. Prediction of early post-transplant outcome is essential so that patients at risk of postoperative short-term mortality can receive increased critical care resources. On the other hand, critically ill post-LT patients in whom early transplant futility can be identified may be better served by redirection to palliative therapy. At present, there are few studies on the early postoperative prognosis of patients with HBACLF undergoing LT worldwide. The advantages of various scoring models can only be assessed in specific recipient settings. No single score model has exhibited a reliable or reproducible discriminative ability to predict early mortality after LT for ACLF.
The aim of this study was to construct a novel prognostic model for prognostic assessment and case selection by comparing the performance of 16 mainstream scoring models in predicting short-term outcome of HBACLF patients after LT.
Material and Methods
STUDY POPULATION:
We studied a retrospective cohort of 135 patients with HBACLF who underwent orthotopic LT from August 2004 to September 2014 as the training group and a prospective cohort of 42 patients from October 2014 to September 2019 as the validation group at a large tertiary specialized hospital. Patients were screened by the following inclusion and exclusion criteria. Inclusion criteria: (1) Etiology was chronic hepatitis B or hepatitis B cirrhosis. (2) Diagnosis was according to the 2019 APASL definition [1] in which ACLF is an acute hepatic insult manifesting as jaundice (serum bilirubin ≥5 mg/dl and coagulopathy (INR ≥1.5 or prothrombin activity <40%) complicated within 4 weeks by clinical ascites and/or encephalopathy in a patient with previously diagnosed or undiagnosed chronic liver disease/cirrhosis, and is associated with a high 28-day mortality) for ACLF. (3) The liver explants were diagnosed pathologically as having “chronic severe hepatitis” or “submassive hepatocyte necrosis” combined with preexisting chronic liver disease. Exclusion criteria: (1) Intraoperative death (1 case) or death within 24 hours after operation (1 case). (2) Cases with variables that cannot be analyzed by missing value imputation (2 cases). (3) Re-transplant cases (1 case). (4) Patients with initial poor graft function (IPGF) [4] (2 cases). Clinical data were extracted from documents, including population demographics, preoperative comorbidities, liver function, coagulatory function, routine blood tests, artificial liver support or renal replacement therapy, respiratory support, surgical techniques, surgical duration, intraoperative blood loss, blood transfusion, and anhepatic phase. All patients were followed up for at least 3 months from LT. Postoperative adverse events and survival time were collected. Scores of 16 models for each patient were calculated (CTP, UNOS-MELD, Updated-MELD, Integrated-MELD, MELD-Na, MLED Na, CLIF-SOFA, CLIF-OFs, CLIF-C ACLFs, CLIF-C ADs, Refit MELD, Refit MELD-Na, MELD-AS, Zheng’s Risk, UKELD, and MESO) (Supplementary Table 1).
SURGICAL PROCEDURE AND MANAGEMENT:
All patients received standard surgical procedures (conventional or piggyback). The immunosuppressive regimen was steroids, calcineurin inhibitors, and mycophenolate mofetil or mycophenolic acid. Basiliximab was applied during the operation and on the fourth day after surgery. Antibiotics prophylaxis was indicated by preoperative bacteriological results or high-risk factors. All patients were dynamically monitored for activation of Epstein-Barr virus/Cytomegalovirus and fungal infections (especially invasive aspergillus). Hepatic vascular blood flow was monitored daily by ultrasound for the first week after surgery to assess whether there was thrombosis. Intravenous injection of hepatitis B immunoglobulin combined with oral nucleoside analog were used to prevent hepatitis B recurrence. Small-dose enteral nutrition in the early postoperative period was administrated and gradually transitioned to total enteral nutrition.
STATISTICAL ANALYSIS:
All statistical analyses were performed using R foundation (R ver.3.5.2,
For the training cohort, time-dependent receiver operating characteristic curves (R package “timeROC”) were used to evaluate the scoring models’ ability to predict postoperative short-outcomes. The area under the receiver operating characteristic curves (AUC) was calculated to assess the diagnostic accuracy. Models with AUC >0.7 were considered to be clinically useful. Combined with the clinical parameters that were associated with early postoperative outcomes in HBACLF patients after LT, each scoring model was entered into LASSO (Least Absolute Shrinkage and Selection Operator, R package “glmnet”) regression one by one. L1-penalized regularization with 10-fold cross-validation for internal validation was applied. The strongest predictive covariates in the final model were selected by the λ.1se. Subsequently, the remaining variables were further selected by Cox regression models (stepwise AIC method) and those still statistically significant variables were used to construct the risk formula. This stepwise variable selection strategy was called the enhanced bootstrap described by Harrell, which computes the validation metric with over-fitting bias correction through bootstrap resampling. The adjusted Brier scores were used to assess the calibration of the final models. Nomograms were constructed based on the final Cox models and the calibration curves were plotted with the R package “rms”. The decision curve was used to represent the net benefit of the constructed models at each threshold of probability [5]. The stability and validity of the final constructed novel model was validated in our validation cohort.
Results
PATIENTS CHARACTERISTICS:
A total of 135 patients with HBACLF who underwent LT were enrolled as the training sample (Table 1); 29 were female and 106 were male. Their average age was 45.0 years old. The predisposing insults included hepatitis B reactivation, infection, acute variceal bleeding, alcoholic abuse, and drug abuse. Most of the patients underwent piggyback LT. The average intraoperative blood loss was 2800 ml and the average surgical duration was 9.5 hours. Twenty-eight (20.7%) patients died within 3 months after LT. Univariate analyses suggested female sex (P=0.02), lymphocyte/neutrophil cell ratio (LNR) (P<0.001), creatinine (P=0.006), need for respiratory support (P=0.04), systemic infection (P=0.001), hepatorenal syndrome (P=0.008), intraoperative transfusion of packed red blood cells (P=0.024), intraoperative placement of T-tube (P=0.034), and surgical duration (P=0.023) were significantly associated with 3-month post-LT mortality.
PREDICTIVE VALUE OF 16 SCORING MODELS:
The scores of 16 models were calculated before LT and their abilities to predict short-term postoperative mortality were compared. MELD-Na score was significantly lower in surviving patients than in those that died (31.1 vs 38.1, P<0.05) and performed the best in predicting 3-month mortality, with an AUC of 0.716 (Supplementary Table 2).
NOVEL PROGNOSTIC MODELS CONSTRUCTION AND COMPARISON:
In addition to the statistically significant variables in univariate analyses (Table 1), other potential clinical factors might also affect early survival after LT (such as hepatic encephalopathy, ascites, and hyponatremia degree). Therefore, we initially enrolled 19 clinical parameters (sex, age, body mass index, diabetes, lymphocyte neutrophil ratio, lymphocyte platelets ratio, creatinine, log (international normalized ratio), hyponatremia, preoperative bacteria cultivation, need for respiratory support before surgery, hepatorenal syndrome, ascites, encephalopathy grade, systemic infection, surgical duration, surgical technique, intraoperative transfusion of packed red blood cells, intraoperative placement of T-tube) based on statistical analysis and the literature for further selection. Combined with the 19 clinical parameters, 16 score models were entered into LASSO regression one by one to eliminate the collinearity and identify the independent predictive factors. Consequently, only the MELD-Na model was confirmed to be an independent predictor (Table 2). A total of 6 statistically significant variables (sex, HRS, systemic infection, MELD-Na, placement of T-tube, and surgical duration) were finally obtained using the L1 regularization for compression of coefficient (Figure 1). Then, a final fitted model (Model 1) with a C-index of 0.881 was obtained after 10-fold cross-validation.
Additionally, the 6 variables were entered into Cox regression (stepwise AIC) for further variable selection. Four clinical variables – sex, systemic infection, place of T-tube, and MELD-Na – were identified in the final Cox regression model (Model 2). Based on the regression coefficients of these independent variables, the risk formula was defined as:
The 3-month survival probability was calculated by the following formula:
The overall C-index of Model 2 was 0.886. After internal validation using enhanced bootstrap resampling, it showed a C-index of 0.844 and a Brier score of 0.131 for 3-month mortality after LT. Model 2 seemed to be more efficient than Model 1, and both Model 1 and Model 2 had more predictive power than single MELD-Na.
Considering the correlation between preoperative lymphocyte/neutrophil ratio (LNR) and the post-LT adverse events [6], we also calculated the predictive accuracy of LNR (AUC 0.711) for 3-month outcomes, indicating a potential predictive value of LNR on early postoperative outcomes. Therefore, nomograms were constructed based on Model 2 with and without LNR (Figure 2). After enhanced bootstrapping, Model 2 plus LNR showed a C-index of 0.875 and a Brier score of 0.116 for 3-month outcomes. However, it was not statistically different compared with Model 2. Decision curves suggested Model 1, Model 2, and Model 2 plus LNR had similar performance and were better than single MELD-Na (Figure 3).
We divided all the patients into high-risk and low-risk groups, with 2.361 as a cutoff value of Risk score derived from Model 2, which provided a sensitivity of 85.2% and a specificity of 78.3% for prediction of 3-month outcomes. Kaplan-Meier curve analysis also revealed a significant difference in survival between the 2 groups (Figure 4).
VALIDATION OF THE NOVEL MODEL IN THE EXTERNAL VALIDATION COHORT:
Of the 42 patients in the validation cohort, 8 died within 3 months after LT. There was no significant difference in early survival between the training cohort and validation cohort (79.3% vs 81.0%, P>0.05, Figure 5A). When the validation cohort was subjected to the novel model (Model 2), the C-index at 3 months was 0.824 (95% CI [0.658, 0.989]) and the Brier score was 0.119 (95% CI [0.004, 0.233]). Similar to the training cohort, this novel model was still able to accurately classify the validation cohort patients into different risk groups using the same cutoff point (Figure 5B).
Discussion
HBACLF is the most common acute exacerbation and severely ill stage of chronic liver disease in China. These patients are in a state of rapid disease progression and urgently need LT. Thus, accurately predicting early survival after transplantation can help avoid futile transplantation and improve the rational allocation of medical care. The original end-stage liver disease model (MELD), MELD-derived models (eg, D-MELD, iMELD, MELD-AS) [7], and multi-organ function evaluation models (eg, APACHE, SOFA) do not have adequate accuracy. Other classical scores, such as pre-allocation survival outcomes following liver transplantation (P-SOFT), balance of risk (BAR), and UCLA futility risk score are not accurate enough in predicting post-LT mortality in critically ill patients due to the diversity of etiologies and the varying severity of underlying diseases [8,9]. To the best of our knowledge, there are no published analyses assessing the performance of scoring systems in HBACLF patients undergoing LT. Therefore, our study investigated the current mainstream scoring models, including liver specific and ICU specific scores, and developed a novel model that can efficiently predict the early prognosis after LT for patients with HBACLF.
In our study, all patients’ serum bilirubin was more than 10 mg/dl and the liver function tests (bilirubin, INR) were significantly worse in patients who met the APASL-ACLF definition. The main organ failures in the HBACLF cohort were ‘liver’ and ‘coagulation’, frequently accompanied with severe hepatic encephalopathy (HE), which tended to occur together and were equivalent to the EASL-ACLF grade of ACLF-2/3 [10]. In general, a higher number of organ failures is associated with more adverse effects, worse prognosis of LT, and the worse organ(s) function that is more difficult to recover from after LT was the ‘Critical Node’ affecting the survival. One of our goals was to find that ‘Critical Node’. Our constructed models incorporated the important results of several researchers who studied the impact of related organ failures on post-LT outcomes, but were not based on the number of patients with organ failure to evaluate prognosis, as there were few cases of cardiac failure or respiratory failure in our study. One important reason was that cardiopulmonary failure can be considered to be a surgical contraindication for LT. Actually, in Western countries, it was widely accepted that the determining factors for prognosis of post-LT for ACLF were the number of cases of organ failure and type rather than MELD score [11–13]. However, in our study population, liver failure, coagulation failure, and cerebral failure were much more prevalent than cardiac failure. The need for respiratory support before LT was due to consciousness changes in nearly 50% of patients, and these cases should not be defined as respiratory failure. Multi-organ scoring systems like CLIF-SOFA or CLIF-C ACLF may not be suitable for assessing prognosis after LT in HBACLF patients, although they had a promising predictive ability for outcome of transplant-free ACLF patients [3]. In January 2016, the Organ Procurement and Transplantation Network (OPTN) changed to follow the ‘sickest’ approach with the use of MELD-Na to allocate liver allograft. Therefore, it is reasonable to grant some flexibility to HBACLF patients by including some important clinical parameters besides MELD-Na score in selectively prioritizing them to receive a liver transplant based on prognostic models.
Although control of sepsis for less than 24 h was considered an absolute contraindication for LT, there were still many patients with subclinical system infection at the time of surgery. Due to impaired immunological function and anti-infective treatment, these patients did not present obvious clinical manifestations such as fever or SIRS, giving them characteristics different from those of patients without liver injury [14]. Thus, it was a challenge for us to identify systemic infection quickly and accurately. Based on our data, as illustrated in Figure 3, a decrease in lymphocyte/neutrophil ratio (LNR) was a potential alternative indicator of a pro-inflammatory state, and was a variable associated with early mortality, which could indicate the occurrence of sepsis in HBACLF candidates, even those with low MELD scores [15]. LNR is not specific for inflammation dysfunction of sepsis, but has face validity given the lack of a superior yet readily available alternative.
We applied LASSO regression in view of elimination of variable collinearity to fit each scoring model and related clinical variables, and found that, of the 16 scoring models, only the MELD-Na score was an independent predictor for early postoperative outcomes of patients with HBACLF undergoing LT, which was consistent with the conclusion of our earlier study [16]. A novel prognostic model consisting of MELD-Na and other clinical variables was further constructed, which was suitable for identifying patients with the highest risk of death after LT. Furthermore, this novel prognostic model is simple and practical because it uses nomogram and DCA analysis, and its stability was verified in the validation cohort. This model provides clinicians with a tool to identify patients who might not benefit from liver transplantation. A cutoff of 2.361 for Risk score was obtained considering both specificity and sensitivity. Patients with Risk score more than 2.361 would clearly be classified to the high-risk group and probably have adverse outcomes. However, how to identify the real high-risk patients in the low-risk group is a challenge. There were 4 cases misclassified out of a total of 71 patients in the low-risk group. To address this problem, Risk score should be calculated as early as the time of admission and be recalculated at days 3–7 during the first week after admission. Those patients with continuously high regulated Risk scores until before surgery had worse outcomes compared to those with stable Risk scores.
There are 3 further points that need to be emphasized. Firstly, due to selection bias, candidates with HBACLF had a higher probability of receiving a high-quality life-saving donor graft. Therefore, to reduce patient heterogeneity, a few cases of IPGF were excluded from the development cohort. Secondly, the same team of surgeons performed the operations and the same team of ICU physicians were responsible for postoperative treatment before transfer to the general ward. Thus, the survival and mortality groups had comparable levels of technical complication. Finally, the study may be criticized because of its retrospective nature. Nontheless, we used a retrospective, nested, case-control study design and, because the study was based in a single hospital with access to all the patients’ clinical documents and biochemistry results, there were few missing data, making the observations robust and increasing the accuracy of the data.
Despite our effort to provide an accurate and comprehensive analysis, limitations still existed in our analysis. Our novel prognostic model was constructed and verified in a group of recipients with HBACLF and might not be applicable to other group of recipients such as those with chronic liver failure. Multicenter studies with larger samples are needed to validate this novel model.
Conclusions
We found that preoperative MELD-Na had superior performance in predicting short-term outcome after LT for patients with HBACLF. Our novel predictive model based on MELD-Na could have clinical benefits in early prognostic assessment and case selection.
Figures
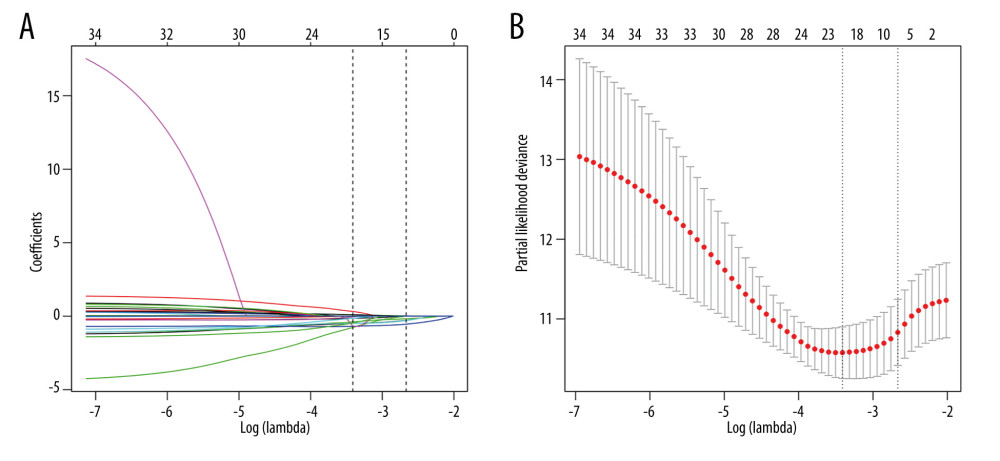 Figure 1. The coefficient compression path map (L1 penalty regularization) (A) and determination of the number of variables selected (lambda.1se: 0.0695) (B).
 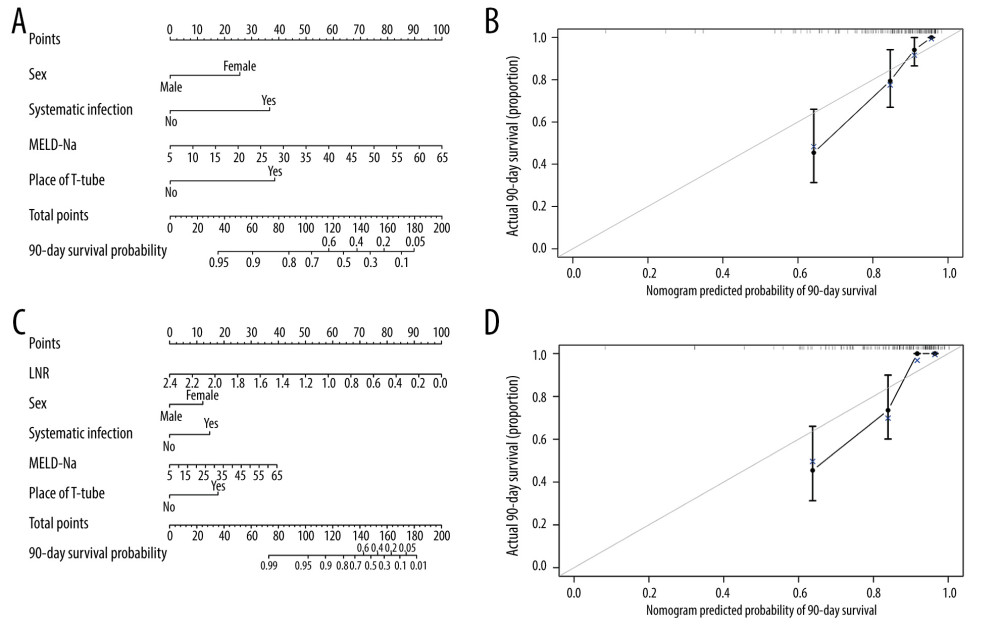 Figure 2. Nomogram for predicting 90-day survival of HBACLF patients after LT. Each independent variable was assigned a score on the top scale, and the sum of these variable scores was located on the Total Points axis, which was mapped to a predicted probability of 90-day survival probability in the lowest scale. The nomogram corresponds to Model 2 without LNR (A) and with LNR (C). The calibration curves were plotted accordingly (B, D).
 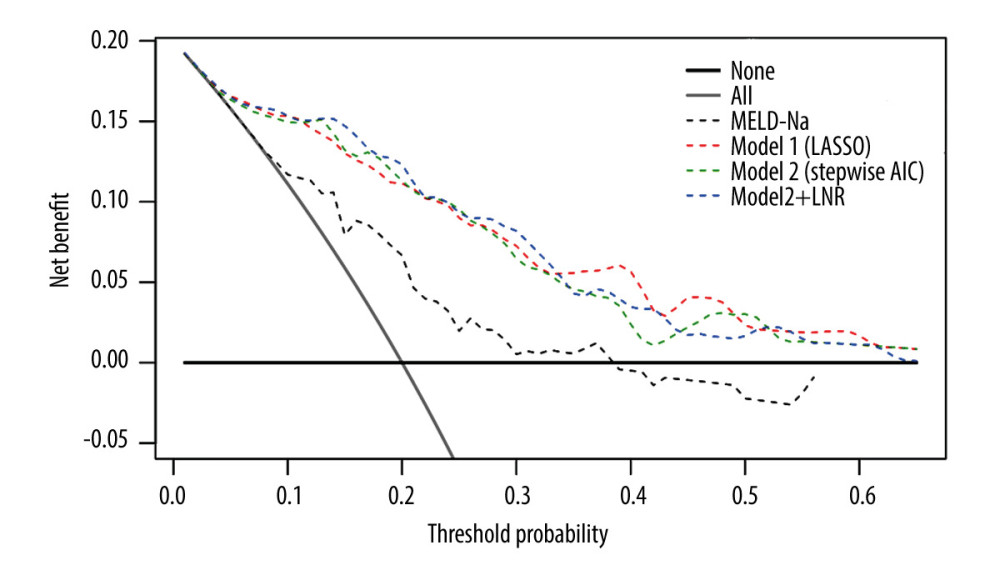 Figure 3. Decision curve analysis was used to assess the net benefit of the constructed models at each threshold of probability. The thick gray line was the net benefit for a strategy of transplanting all men; the thick black line shows the net benefit of transplanting no men. The dashed lines show the net benefit of a strategy of treating patients according to the models.
 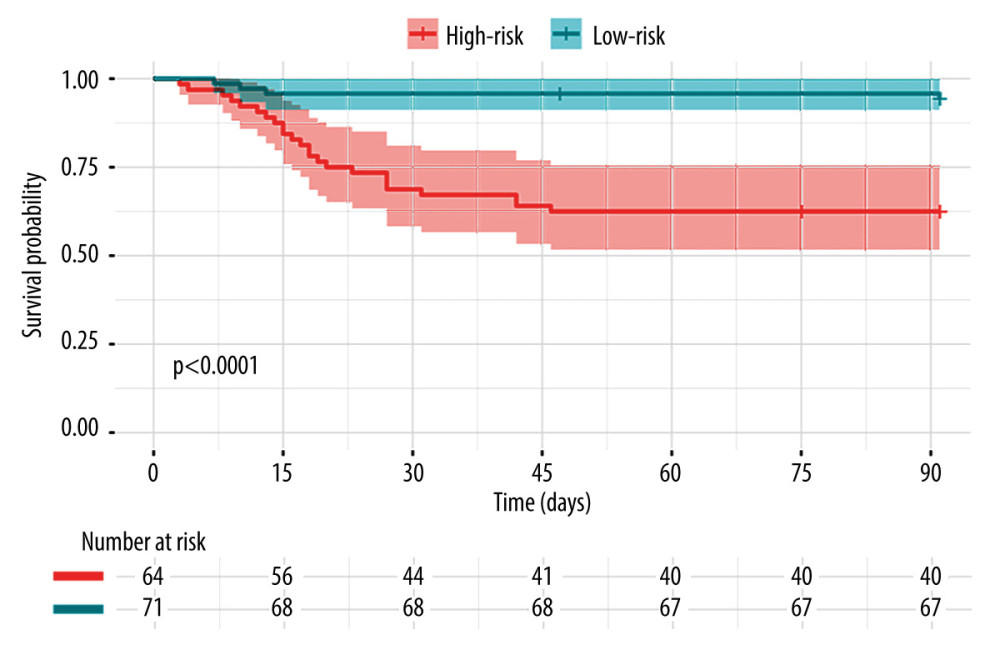 Figure 4. Patients were stratified into 2 risk groups according to the cutoff of Risk score – a high-risk group with Risk score ≥2.361 and a low-risk group with Risk score <2.361. The actual (Kaplan-Meier) and the expected survival of the 2 groups were compared using the log-rank test.
 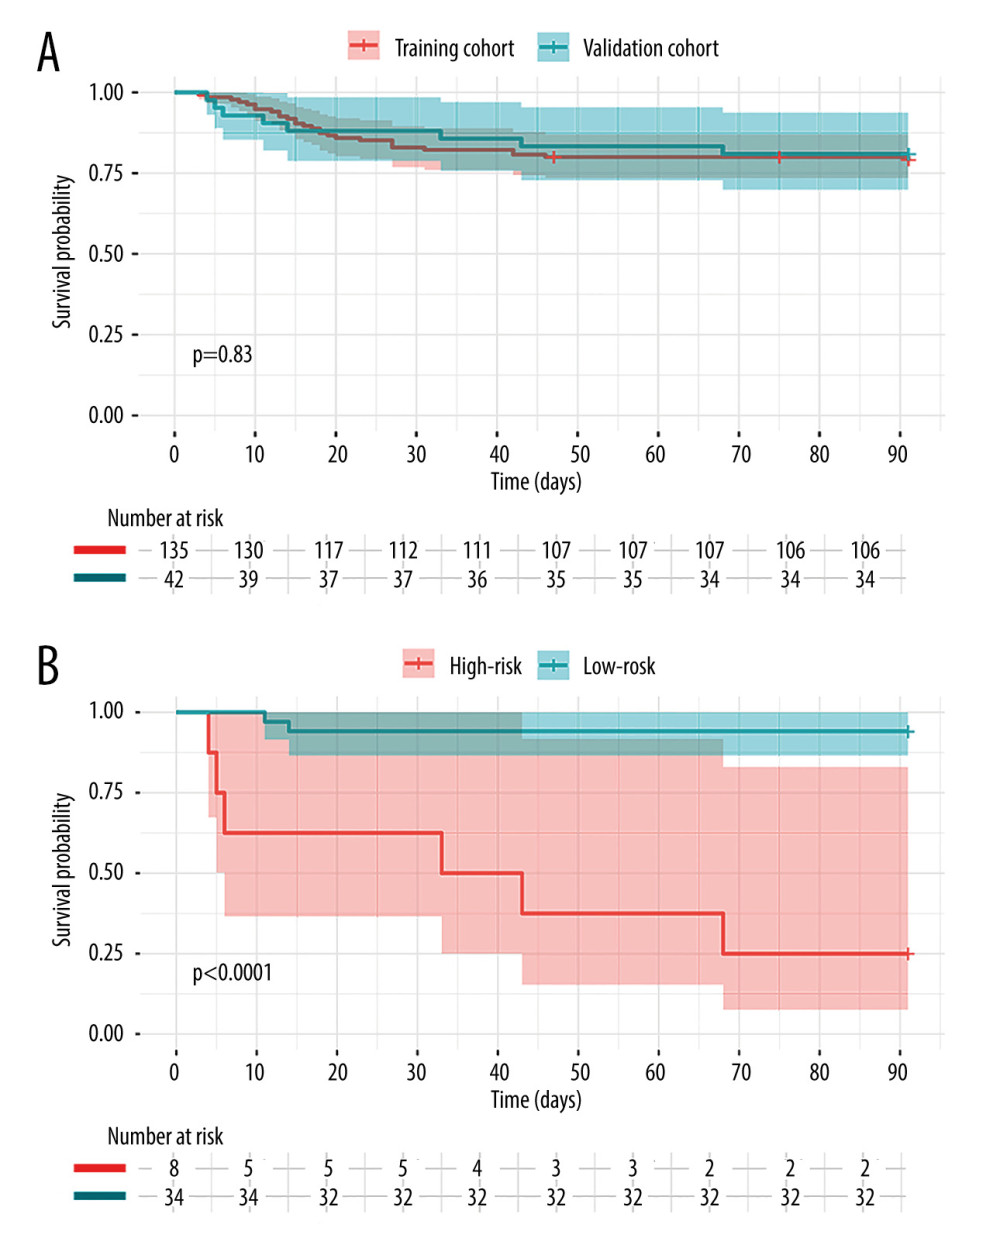 Figure 5. (A) Kaplan-Meier survival analysis of the 2 groups at 3 months. The red line and blue line represent training cohort and validation cohort, respectively. (B) The survival curve in the validation cohort. The red line is the high-risk group with Risk score ≥2.361 and the blue line is low-risk group with Risk score <2.361.
 Tables
Table 1. Clinical characteristics comparison between HBACLF patients survived and died within 3 months after liver transplantation.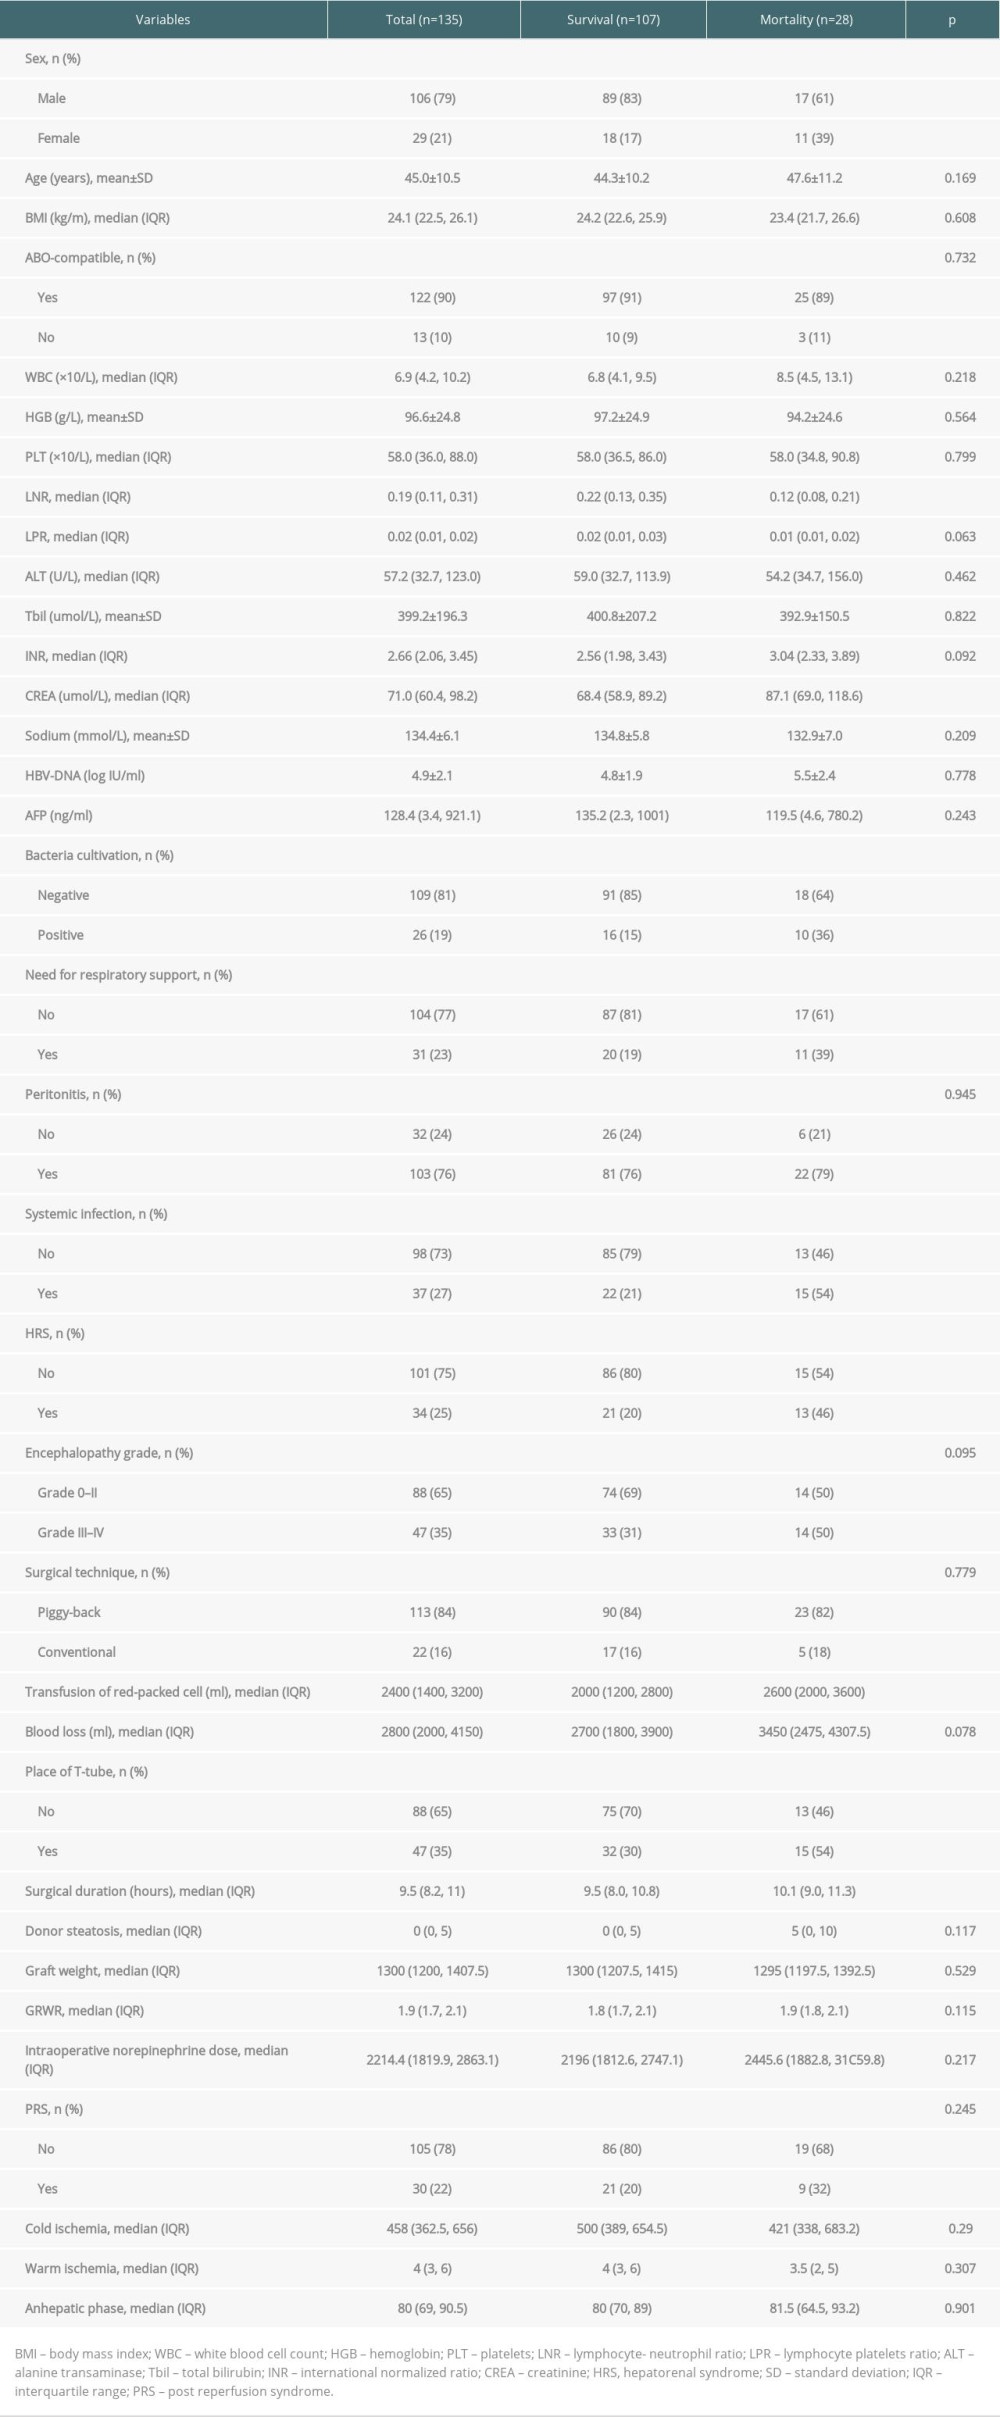 Table 2. Novel prognostic models constructed by LASSO and Cox regresion in predicting postoperative short-term mortality of HBACLF patients after liver transplantation.
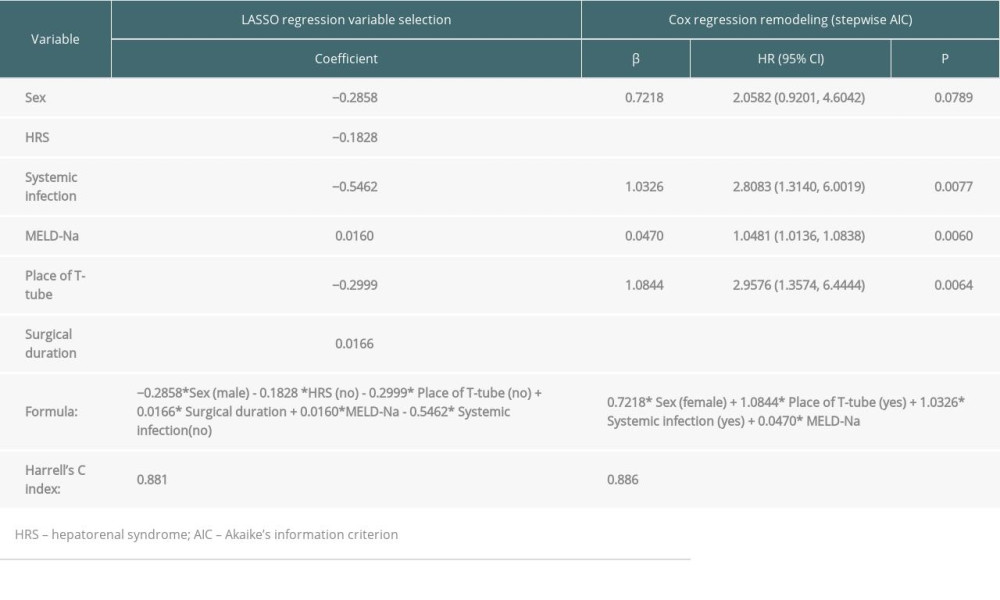 Supplementary Table 1. The formula of 16 scoring models.
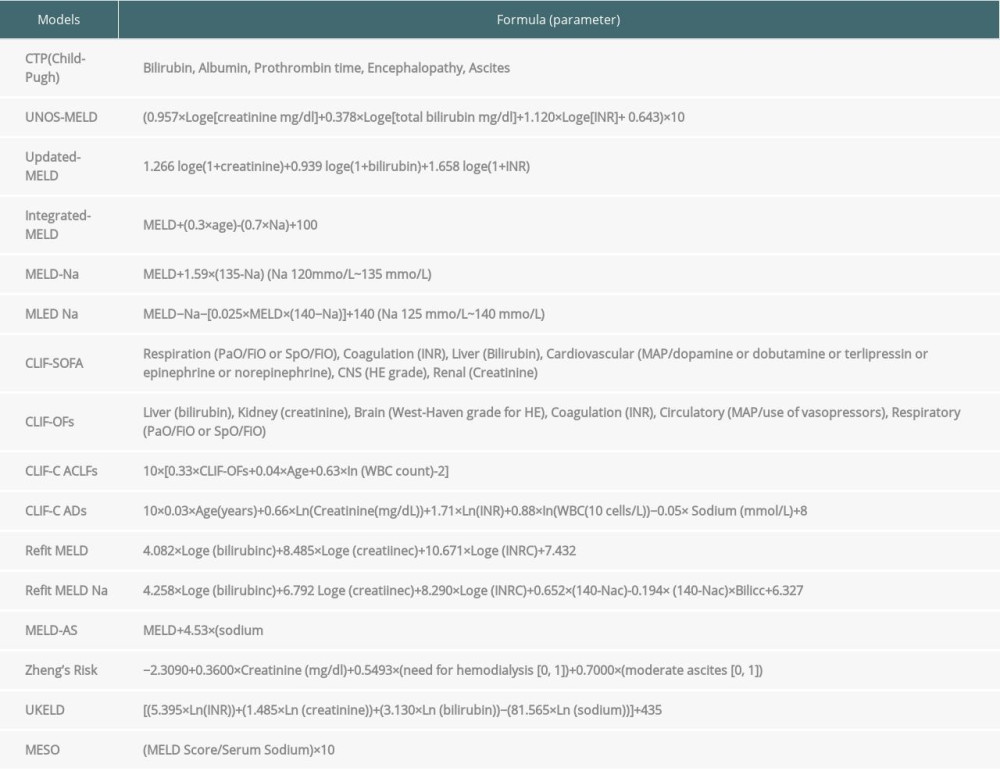 Supplementary Table 2. Area under the time-dependent ROC curve of 16 scoring models in predicting postoperative short-term mortality of HBACLF patients after liver transplantation.
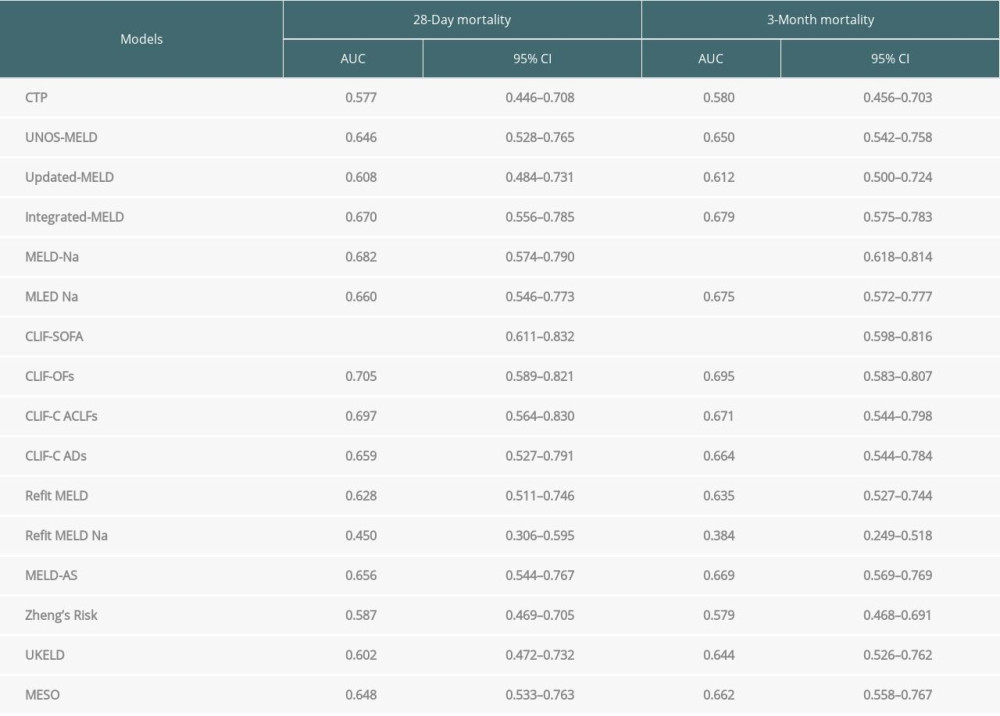
References
1. Sarin SK, Choudhury A, Sharma MK, Acute-on-chronic liver failure: Consensus recommendations of the Asian Pacific association for the study of the liver (APASL): An update: Hepatol Int, 2019; 13(4); 353-90
2. Wu T, Li J, Shao L, Development of diagnostic criteria and a prognostic score for hepatitis B virus-related acute-on-chronic liver failure: Gut, 2018; 67(12); 2181-91
3. Barosa R, Roque Ramos L, Patita M, CLIF-C ACLF score is a better mortality predictor than MELD, MELD-Na and CTP in patients with acute on chronic liver failure admitted to the ward: Rev Esp Enferm Dig, 2017; 109(6); 399-405
4. Nanashima A, Pillay P, Verran DJ, Analysis of initial poor graft function after orthotopic liver transplantation: Experience of an australian single liver transplantation center: Transplant Proc, 2002; 34(4); 1231-35
5. Vickers AJ, Cronin AM, Elkin EB, Extensions to decision curve analysis, a novel method for evaluating diagnostic tests, prediction models and molecular markers: BMC Med Inform Decis Mak, 2008; 8; 53
6. Kwon HM, Moon YJ, Jung KW, Neutrophil-to-lymphocyte ratio is a predictor of early graft dysfunction following living donor liver transplantation: Liver Int, 2019; 39(8); 1545-56
7. Schrem H, Reichert B, Frühauf N, The Donor-Risk-Index, ECD-Score and D-MELD-Score all fail to predict short-term outcome after liver transplantation with acceptable sensitivity and specificity: Ann Transplant, 2012; 17(3); 5-13
8. Dutkowski P, Oberkofler CE, Slankamenac K, Are there better guidelines for allocation in liver transplantation? a novel score targeting justice and utility in the model for end-stage liver disease era: Ann Surg, 2011; 254(5); 745-53
9. Petrowsky H, Rana A, Kaldas FM, Liver transplantation in highest acuity recipients identifying factors to avoid futility: Ann Surg, 2014; 259(6); 1186-94
10. Li H, Chen LY, Zhang NN, Characteristics, diagnosis and prognosis of acute-on-chronic liver failure in cirrhosis associated to hepatitis B: Sci Rep, 2016; 6; 25487
11. Sundaram V, Jalan R, Wu T, Factors associated with survival of patients with severe acute-on-chronic liver failure before and after liver transplantation: Gastroenterology, 2019; 156(5); 1381-91e1383
12. Artru F, Louvet A, Ruiz I, Liver transplantation in the most severely ill cirrhotic patients: A multicenter study in acute-on-chronic liver failure grade 3: J Hepatol, 2017; 67(4); 708-15
13. Choudhary NS, Saraf N, Soin AS, Liver transplantation for grade 3 acute-on-chronic liver failure: Type of organ failure is important: J Hepatol, 2018; 68(3); 621-22
14. Xue R, Zhu Y, Liu H, The clinical parameters for the diagnosis of hepatitis B virus related acute-on-chronic liver failure with sepsis: Sci Rep, 2019; 9(1); 2558
15. Kalra A, Wedd JP, Bambha KM, Neutrophil-to-lymphocyte ratio correlates with proinflammatory neutrophils and predicts death in low model for end-stage liver disease patients with cirrhosis: Liver Transpl, 2017; 23(2); 155-65
16. Zhang QK, Wang ML, Value of model for end-stage liver disease-serum sodium scores in predicting complication severity grades after liver transplantation for acute-on-chronic liver failure: Transplant Proc, 2019; 51(3); 833-41
Figures
Figure 1. The coefficient compression path map (L1 penalty regularization) (A) and determination of the number of variables selected (lambda.1se: 0.0695) (B).Figure 2. Nomogram for predicting 90-day survival of HBACLF patients after LT. Each independent variable was assigned a score on the top scale, and the sum of these variable scores was located on the Total Points axis, which was mapped to a predicted probability of 90-day survival probability in the lowest scale. The nomogram corresponds to Model 2 without LNR (A) and with LNR (C). The calibration curves were plotted accordingly (B, D).Figure 3. Decision curve analysis was used to assess the net benefit of the constructed models at each threshold of probability. The thick gray line was the net benefit for a strategy of transplanting all men; the thick black line shows the net benefit of transplanting no men. The dashed lines show the net benefit of a strategy of treating patients according to the models.Figure 4. Patients were stratified into 2 risk groups according to the cutoff of Risk score – a high-risk group with Risk score ≥2.361 and a low-risk group with Risk score <2.361. The actual (Kaplan-Meier) and the expected survival of the 2 groups were compared using the log-rank test.Figure 5. (A) Kaplan-Meier survival analysis of the 2 groups at 3 months. The red line and blue line represent training cohort and validation cohort, respectively. (B) The survival curve in the validation cohort. The red line is the high-risk group with Risk score ≥2.361 and the blue line is low-risk group with Risk score <2.361. Tables
Table 1. Clinical characteristics comparison between HBACLF patients survived and died within 3 months after liver transplantation.Table 2. Novel prognostic models constructed by LASSO and Cox regresion in predicting postoperative short-term mortality of HBACLF patients after liver transplantation.Table 1. Clinical characteristics comparison between HBACLF patients survived and died within 3 months after liver transplantation.Table 2. Novel prognostic models constructed by LASSO and Cox regresion in predicting postoperative short-term mortality of HBACLF patients after liver transplantation.Supplementary Table 1. The formula of 16 scoring models.Supplementary Table 2. Area under the time-dependent ROC curve of 16 scoring models in predicting postoperative short-term mortality of HBACLF patients after liver transplantation. In Press
15 Mar 2024 : Review article
Approaches and Challenges in the Current Management of Cytomegalovirus in Transplant Recipients: Highlighti...Ann Transplant In Press; DOI: 10.12659/AOT.941185
18 Mar 2024 : Original article
Does Antibiotic Use Increase the Risk of Post-Transplantation Diabetes Mellitus? A Retrospective Study of R...Ann Transplant In Press; DOI: 10.12659/AOT.943282
20 Mar 2024 : Original article
Transplant Nephrectomy: A Comparative Study of Timing and Techniques in a Single InstitutionAnn Transplant In Press; DOI: 10.12659/AOT.942252
28 Mar 2024 : Original article
Association Between FEV₁ Decline Rate and Mortality in Long-Term Follow-Up of a 21-Patient Pilot Clinical T...Ann Transplant In Press; DOI: 10.12659/AOT.942823
Most Viewed Current Articles
05 Apr 2022 : Original article
Impact of Statins on Hepatocellular Carcinoma Recurrence After Living-Donor Liver TransplantationDOI :10.12659/AOT.935604
Ann Transplant 2022; 27:e935604
12 Jan 2022 : Original article
Risk Factors for Developing BK Virus-Associated Nephropathy: A Single-Center Retrospective Cohort Study of ...DOI :10.12659/AOT.934738
Ann Transplant 2022; 27:e934738
22 Nov 2022 : Original article
Long-Term Effects of Everolimus-Facilitated Tacrolimus Reduction in Living-Donor Liver Transplant Recipient...DOI :10.12659/AOT.937988
Ann Transplant 2022; 27:e937988
15 Mar 2022 : Case report
Combined Liver, Pancreas-Duodenum, and Kidney Transplantation for Patients with Hepatitis B Cirrhosis, Urem...DOI :10.12659/AOT.935860
Ann Transplant 2022; 27:e935860