02 August 2022 : Original article
The Association Between Tacrolimus Levels and Hyperkalemia in Allograft Recipients Who Underwent Heart or Lung Transplantation in New Orleans, USA Between 2013 and 2019: A Single-Center Retrospective Study
Olivia L. GriffisDOI: 10.12659/AOT.935607
Ann Transplant 2022; 27:e935607


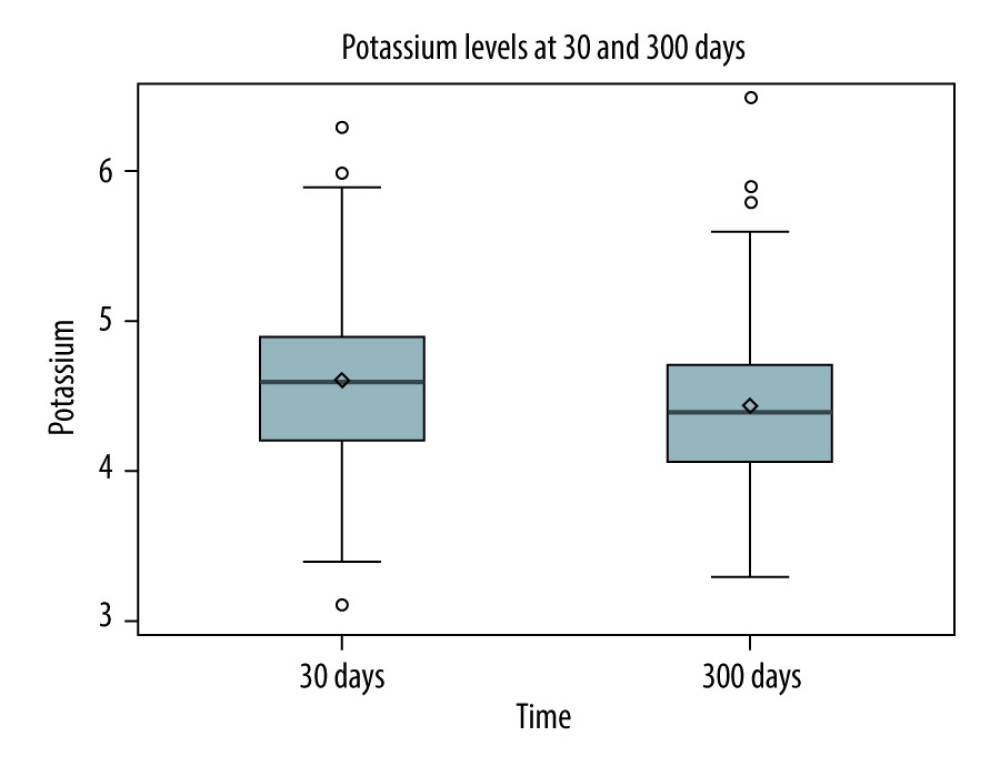
Figure 4 Potassium levels 30 days post-transplant (high tacrolimus exposure) versus 300 days post-transplant (low tacrolimus exposure)Figure represents the data drawn from a Spearman correlation analysis. The box contains the standard deviation for each data set. The horizontal line in the box represents the median, and the diamond in the box represents the mean. The lines that extend from the box represent the interquartile ranges for each dataset. Finally, any circles outside of the box and lines represent any outliers in the dataset. Figure created with Microsoft Word 2016, manufactured by the Microsoft Corporation.