20 May 2025: Original Paper
Prognostic Nutritional Index Trajectories Predict Kidney Function in Kidney Transplant Recipients: A Latent Class Growth Model Study
Xinyi Zhou CEF 1, Juan Yu BE 2, Ke Shi AF 3, Xiaohong Guan B 4, Tian Zhang CD 5, Wenjing Zhao B 1, Hailing Zhang ADE 1*
DOI: 10.12659/AOT.947388
Ann Transplant 2025; 30:e947388


Abstract
BACKGROUND: Nutritional status can be an important, dynamic determinant of clinical outcomes in kidney transplant recipients. This study investigated the trajectory and potential classes of the prognostic nutritional index (PNI) in kidney transplant recipients using a latent class growth model (LCGM), and assessed their predictive role in renal allograft function.
MATERIAL AND METHODS: This retrospective study included 257 kidney transplant recipients who received treatment in a tertiary hospital in Anhui Province from January 2019 to November 2020. Their data were collected at each 4 timepoints: T0 (pre-surgery, using the results of the recipient’s most recent laboratory test prior to transplant), T1, T2, and T3 (1, 6, and 12 months, respectively after transplant surgery). The LCGM was conducted using Mplus 8.4, and a multiple linear regression model was employed to examine the ability of PNI trajectory to predict renal allograft function.
RESULTS: Using LCGM, 2 classes of PNI patterns best fit the sample: the low PNI slow growth group (C1, n=122,47.5%) and the high PNI fast growth group (C2, n=135, 52.5%). The linear regression showed that being a woman and being in the high PNI fast growth group were negative predictors of a high creatinine level (B=-35.946, P<0.001; B=-15.147, P=0.023).
CONCLUSIONS: There were 2 trajectories of PNI in the sample, with lower creatinine values 1 year after transplantation in the high PNI fast growth class. The initial level and developmental rate of PNI can positively predict renal allograft function. PNI may serve as a prognostic marker for renal allograft function in kidney transplant recipients.
Keywords: Nutrition Assessment, Kidney Transplantation, Creatinine, Humans, Female, Male, Retrospective Studies, Middle Aged, adult, Prognosis, Nutritional Status, Latent Class Analysis, transplant recipients, kidney, Kidney Function Tests
Introduction
Kidney transplantation is currently regarded as being a better kidney replacement therapy for treatment of patients with end-stage renal disease than hemodialysis or peritoneal dialysis [1]. In 2020, the annual number of kidney transplant recipients (KTRs) in China was 11 037, second only to the United States [2]. However, the number of patients on the waiting list continues to rise, and the demand for kidney transplants far exceeds the supply of available organs. Therefore, improving the long-term survival rate of grafts and reducing the need for re-transplantation are of paramount importance. Maintaining renal allograft function is the key to minimizing the complications associated with advanced chronic kidney disease (CKD) and improving patient survival [3]. However, KTRs may face many health problems because of chronic rejection, immunosuppression, and complications, which can seriously affect the survival of the transplanted kidney [4]. It is critical to accurately predict the renal allograft function and to look for influencing factors so that suitable interventions can be implemented.
In addition to post-transplant complications such as rejection and infection, nutritional status may be a significant determinant of clinical outcomes in KTRs [5]. Although KTRs are no longer subject to most dietary restrictions after transplantation and may experience increased appetite, potentially improving their nutritional status, the use of immunosuppressants and glucocorticoids can promote gastrointestinal discomfort, lead to dysbiosis, and interfere with nutrient absorption. Simultaneously, these medications can also contribute to dyslipidemia, glucose metabolism disorders, and other complications [6]. Studies have shown that extremes of body mass index (BMI) (both obesity and underweight) are associated with poorer survival and graft function in KTRs [7]. In a study involving 451 KTRs, nearly 80% were classified as being at moderate to high risk of malnutrition. Patients with higher risk of malnutrition were associated with lower graft survival rates and higher incidence of infections [8]. Furthermore, malnutrition in KTRs is an important factor in the development of complications and can affect renal allograft function [9].
The prognostic nutritional index (PNI) is a marker determined by the serum albumin level and lymphocyte count in the peripheral blood and can reflect both the nutritional and immune status of the patient [10]. Compared with other nutritional assessment tools, PNI is a simple and objective indicator, suitable for rapid assessment of nutritional status [11]. In recent years, the PNI has attracted increased attention in the field of kidney disease. Studies have suggested that the PNI is an independent prognostic factor for CKD [12,13]. A large-sample retrospective study of patients with CKD demonstrated that a low PNI was associated with higher all-cause mortality [14]. Another study demonstrated that a higher PNI is associated with a reduced risk of all-cause mortality and cardiovascular mortality in hemodialysis patients, and found that PNI is a stronger predictor of mortality than serum albumin levels or total lymphocyte count [15]. Among KTRs with COVID-19, those with a lower PNI exhibited a higher mortality rate [16]. More and more researches have utilized the PNI as a marker of immunonutrition to predict disease progression and outcomes [17].
A study that tracked PNI trends in KTRs showed that PNIs stabilized after an initial increase in the post-transplant period [18], but it did not further investigate and explore the heterogeneity in the development of the PNI within samples. In practice, the trajectory of change in the PNI can vary among individuals and there may be different subgroups of PNI trends. The latent class growth model (LCGM) is a statistical method that offers significant advantages over traditional growth curves or multilevel models in analyzing longitudinal data. Specifically, it not only assesses overall trends but also accounts for population heterogeneity, enabling a more nuanced understanding of variation patterns within individuals or groups [19]. It assumes the existence of several qualitatively different classes within a group, allowing for more accurate characterization of the trajectory of variables [20].
Understanding the trajectories of the PNI, especially in the early post-transplantation period, is key to understanding mechanisms behind changes in the nutritional and immune status of KTRs and the implementation of preventative strategies. In this study, we sought to characterize the trajectories of the PNI of KTRs by using an LCGM and explored the predictive ability of different trajectories of PNI in renal allograft function.
This study had 2 hypotheses:
Material and Methods
DESIGN AND SAMPLE:
This was a retrospective study. We chose subjects who had received a kidney-only transplant at our center between January 2019 and November 2020. The inclusion criteria were: (1) 18 years of age or older, (2) followed up regularly at our outpatient department for more than 1 year after the operation, (3) complete clinical data and follow-up information. The exclusion criteria were: (1) acute rejection or graft failure during the data collection period, (2) received exogenous insulin within 24 hours of exogenous albumin infusion at the time of collection of laboratory indicators [21], (3) severe edema or acute inflammatory states at the time of laboratory data collection. Severe edema was defined as edema extending to the superficial tissues of the entire body, accompanied by deep-tissue depression after pressing with the thumb, and a slow recovery period or worse [22,23]. The acute inflammatory state, defined by elevated levels of C-reactive protein (CRP) (>10 mg/L) [24], may originate from either infectious or sterile causes. As there are no explicit sample size requirements for LCGM [20], based on the inclusion and exclusion criteria within the research period, we collected information on 257 patients.
ETHICAL CONSIDERATION:
This study was approved by the Ethics Committee of the First Affiliated Hospital of the University of Science and Technology of China (approval no. 2022-RE-416) and conformed to the provisions of the Declaration of Helsinki. The data for the study were obtained through a retrospective review of a database; therefore, the requirement for informed consent was waived.
MEASUREMENTS:
The following data were collected on all subjects: age, sex, level of education, marital status, height, weight, residence, source of the transplanted kidney, dialysis-related data, complications, and laboratory data history (serum creatinine levels, serum albumin levels, lymphocyte count). PNI=10×serum albumin (g/dL)+0.005×total lymphocyte count (/mL). Direct measurement of glomerular filtration rate (GFR) using exogenous filtration markers (eg, inulin) is the criterion standard for estimating kidney function. However, the methods used to measure GFR are complex and costly. Serum creatinine is a widely used endogenous biomarker reflecting GFR. Its concentration is negatively correlated with GFR and indirectly reflects GFR [25]. In addition, creatinine is easy and inexpensive to measure. Given the realities of follow-up of KTRs, creatinine was used as an index to assess the function of the transplanted kidney in this study.
DATA COLLECTION:
Trained researchers used a comprehensive database known as the Hospital Information System, which has all data we needed to use. Laboratory data were collected at each time point: T0 (pre-surgery, using the results of the recipient’s most recent laboratory test prior to transplant), and T1, T2, and T3 (1, 6, and 12 months, respectively, after surgery). The 2019 Chinese guidelines for post-kidney transplant follow-up [26] categorize follow-up into 3 phases: early (within 3 months after transplant), intermediate (3–6 months after transplant), and long-term (beyond 6 months after transplant). Combining the frequency and focus of follow-up, postoperative months 1, 6, and 12 were selected as the timepoints for PNI measurement in this study.
DATA ANALYSIS:
Microsoft Excel 2019 was used for entering the data, and IBM SPSS V.26 was used for analyzing the statistical data. Mean, standard deviation, percentages, and frequency counts were used for the descriptive statistics. The trajectories of the PNI of the KTRs were classified using LCGM. Mplus 8.4 was used for the LCGM. The analysis used the Akaike information criterion (AIC), the Bayesian information criterion (BIC), the adjusted BIC (aBIC), entropy, the Lo-Mendell-Rubin (LMR) likelihood ratio test, and the bootstrapped likelihood ratio test (BLRT) test to determine the number of latent classes. The optimal class model was determined based on the principle that “higher entropy, lower AIC, BIC, and aBIC, and significant P values for both LMR and BLRT resulted in a better model fit” [27]. Meanwhile, the number of people in each subgroup should not be less than 5% of the total number of people in this study. SPSS 26.0 software was used to analyze the characteristics of different trajectories of PNI. A multiple linear regression was performed to investigate the relationship between different trajectories of PNI and renal allograft function in KTRs.
Results
GENERAL INFORMATION OF THE KTRS:
A total of 257 KTRs were analyzed in this study. Most of the participants were male (75.5%). They ranged in age from 18 to 55 years, and their mean (SD) age was 32.54 (7.31) years. Their BMI ranged from 15.82 to 33.77 kg/m2, and their mean (SD) BMI was 21.82 (3.37) kg/m2. All of these KTRs had received a living donor transplant from a matched relative. The preoperative comorbidities among KTRs were: hypertension (225 cases), diabetes (1 case), heart disease (1 case), hypertension combined with heart disease (7 cases), hypertension combined with diabetes (1 case), and hypertension combined with cerebrovascular disease (3 cases: 1 brainstem hemorrhage and 2 cerebral infarctions). More information on the condition and characteristics of the patients is given in Table 1.
TRAJECTORIES OF THE PNI OF KTRS:
Table 2 lists the mean, SD, and Pearson correlation coefficient matrix for the PNI at the 4 measurement timepoints. The results show a positive pairwise correlation (P<0.01) between the PNI values at the 4 measurement time points, reflecting the continuity of developmental change. The mean of the 4 measurements tended to increase and then decrease.
Prior to conducting the LCGM, we had to decide how to code time. Data were collected at the following assessment points: pre-surgery, 1 month after surgery, 6 months after surgery, and 12 months after surgery. Thus, we chose to freely estimate the remaining factor loadings to reflect times that might not follow a standard mathematical shape. Model fit was evaluated based on AIC, BIC, aBIC, LMR, BLRT, and entropy values in Mplus, to determine the number of classes comparing k−1 models. The LCGM model with 3 classes had slightly better AIC, BIC, aBIC, and entropy values than did the model with 2 classes (Table 3). However, LMR and BLRT are used to examine whether the k-class models are a significant improvement over the k−1 class models in terms of fit, and are an important reference for model acceptance. Also, in principle, a model is only considered for acceptance if the LMR is significant. The LMR and BLRT values for the model with 2 classes were both less than 0.05 and the entropy value was 0.66, making the model acceptable. Therefore, the model containing 2 classes was selected for this study.
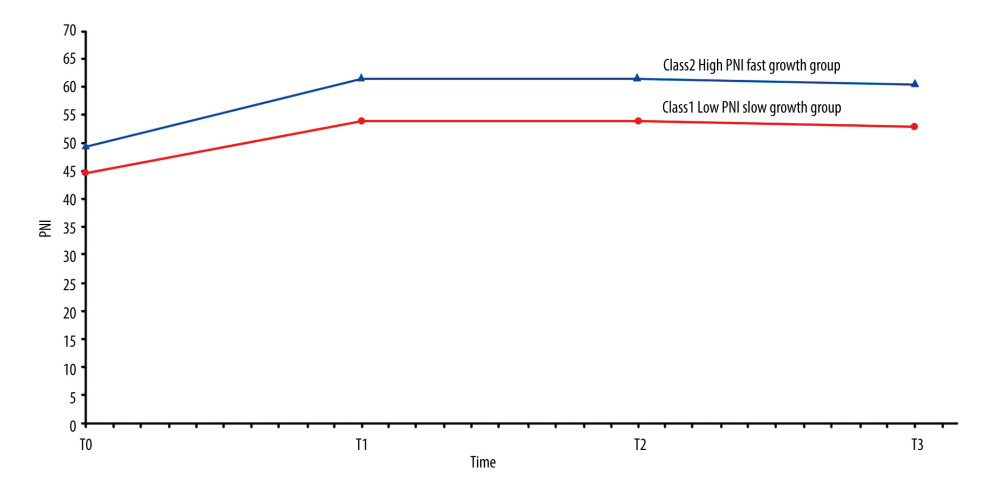
The mean value of the intercept describes the average initial state of the individual. The mean of the slope reflects the average growth rate between timepoints. The significance of the mean of the intercept and the mean of the slope represents the difference in the initial level and the growth rate, respectively [28]. Based on the trajectories shown in Figure 1, KTRs were classified into 2 distinct groups: a low PNI slow growth group (Class 1[C1]; intercept: 44.67; slope: 9.25), characterized by lower initial PNI values and a slower rate of increase over time, and a high PNI fast growth group (Class 2[C2]; intercept: 49.44; slope: 12.01), characterized by higher initial PNI values and a faster rate of increase over time. Consequently, the KTRs were divided into C1 (n=122, 47.5%) and C2 (n=135, 52.5%).
THE PREDICTIVE ROLE OF PNI TRAJECTORY ON SERUM CREATININE LEVELS:
The KTRs serum creatinine levels of T3 measurements ranged from 55 to 294 μmol/L, and their mean (SD) creatinine level was 110.95 (39.07) μmol/L. Age, sex, BMI, PNI trajectory, level of education, marital status, residence, dialysis-related data and preoperative comorbidities were the independent variables, with T3 serum creatinine as the dependent variable. Since sex, PNI trajectory, level of education, marital status, residence, preoperative comorbidities and type of dialysis are categorical variables, dummy variables were set for each categorical variable to perform multiple linear regression analyses. The results of the multiple linear regression model showed that sex and PNI trajectory were determinants of serum creatinine level. Women (B=−35.95, P <0.001) and the high PNI fast growth group (B=−15.15, P=0.023) were more likely to have a lower level of creatinine. These results are presented in Table 4.
Discussion
Previous studies of KTRs’ nutritional status were mostly cross-sectional. Gradually, KTRs’ level of health, dose of immunosuppressants and psychological status are constantly changing, which leads to a change in KTRs’ nutritional status. Therefore, this study not only explored how the PNI of KTRs changed over time from before the surgery to 1 year after surgery, but also plotted their trajectories. By using LCGM, we identified 2 trajectory groups in KTRs, and named them the “low PNI slow growth group” and the “high PNI fast growth group”.
Two trajectories demonstrated a similar shape, and the PNI of the KTRs show a trend of increasing and then decreasing within 1 year. Compared to the preoperative PNI values, the PNI improved significantly at 1 month postoperatively. From 6 months postoperatively, the PNI values tended to decrease slowly but remained higher than before transplantation. This indicated that transplantation significantly improved the nutritional status of patients with end-stage renal disease and that this status was maintained over a certain period of time. Our study found a similar trend to that of a Japanese longitudinal study of PNI in KTRs [18]. The PNI at 1 month after kidney transplantation was almost equal to the preoperative PNI and then gradually increased until 12 months after the operation, when it began to slowly decline. Our study showed that the inflection point at which PNI values changed from a rapid increase to a slow decrease was at 6 months postoperatively, which may be related to the fact that the immunosuppressive dose was at a maintenance level at this time, and the recipient’s body gradually recovered its ability to resist infection and stabilized its immune and nutritional status [26]. Furthermore, such a discrepancy could arise because of a “honeymoon period”, termed as such because studies have shown that the level of health and quality of life of KTRs show an initial trend towards improving followed by a slow decline. The time of “honeymoon period” has been controversial. A study demonstrated that KTRs experienced significant improvements in physical functioning and the physical domains of health-related quality of life (HRQOL) domains during the first postoperative year [29]. Another study suggested that there is a greater likelihood of frailty 2.5 years after kidney transplantation [30].
In our study, the linear regression analysis results showed that female sex was an independent predictor for postoperative creatinine values. It is well known that women generally have lower baseline serum creatinine levels [31], so this will not be discussed in the present paper. We also found that being in the high PNI fast growth group and having lower creatinine values were protective factors for renal allograft function. Lower PNI means decreased lymphocytes and serum albumin. Albumin is a major circulating protein that plays a number of biological roles, such as maintaining osmotic pressure and transporting a variety of molecules. Although albumin is not a reliable indicator of nutritional status, it can be considered as a complementary tool in assessing nutritional health. Its concentration can be affected by the patient’s fluid status, systemic inflammation, the presence and extent of proteinuria and other conditions [32]. A cohort study of CKD patients showed a negative and non-linear association between serum albumin and renal function decline, as well as renal prognosis. Serum albumin levels decline was closely related to poor renal prognosis and renal function decline [33]. It has also been reported that severe pretransplant hypoalbuminemia is an independent risk factor for graft loss [34], and B cell lymphopenia was negatively correlated with the progression of CKD [35]. Previous studies on the PNI of those who had undergone a solid organ transplant indicated that preoperative low PNI was an independent risk factor for a poor prognosis [36,37]. Our study indicated that both the preoperative PNI and the dynamically changing level of PNI are highly likely to affect the prognosis. In addition, a higher initial PNI level was linked to a faster growth rate in the 2 PNI trajectories in this study. The correlation and mechanism of the initial PNI value with the PNI growth rate have yet to be further explored.
PNI may be a useful marker of prognosis in KTRs, as it is a comprehensive marker that integrates immune, nutritional, and chronic inflammation. Although a lower PNI can be influenced by non-nutritional factors, hypoalbuminemia is often associated with malnutrition [17]. The Expert Consensus on Accelerated Perioperative Rehabilitation Management of Kidney Transplantation in China (2018) clearly states that pre-transplantation nutritional assessments and post-transplantation monitoring of nutritional status will facilitate rapid post-transplantation recovery [38]. An investigation conducted in China revealed that the prevalence of malnutrition among KTRs at the time of hospital discharge was 42.0% [39]. In a retrospective study, Orazio et al observed that only 35% of the KTRs received nutritional care in accordance with the guidelines [40]. Therefore, we recommend continuous monitoring of PNI in KTRs, targeted intervention based on different PNI trajectories, and the provision of phased and individualized nutritional support. Particular attention should be paid to the intake of immune-related micronutrients, such as vitamin D [32]. Furthermore, the implementation of dynamic monitoring of drug concentrations is imperative to avert excessive suppression of lymphocytes. In summary, to improve the prognosis of KTRs, the prevention and timely correction of low protein and/or lymphocyte levels are crucial.
The small sample size and retrospective and single-center design are limitations of this study. Nutritional status and renal allograft function should be assessed not only by PNI and creatinine, but also by malnutrition inflammation score, skinfold measurements, and estimated GFR [32]. Due to lack of data, these indicators could not be examined in this study. To confirm our findings, prospective cohort studies with longer follow-up and larger sample sizes are needed.
Conclusions
This study found 2 trajectories of PNI in the sample by LCGM, and detected that the high PNI fast growth group had lower creatinine levels 1 year after transplantation. The initial level and developmental rate of PNI can positively predict renal allograft function. In follow-up work, we will explore an optimal cutoff value for PNI in KTRs and population characteristics of different trajectories of PNI, to identify KTRs at particular risk in advance and provide early intervention.
Tables
Table 1. Sociodemographic and clinical characteristics of the KTRs (n=257).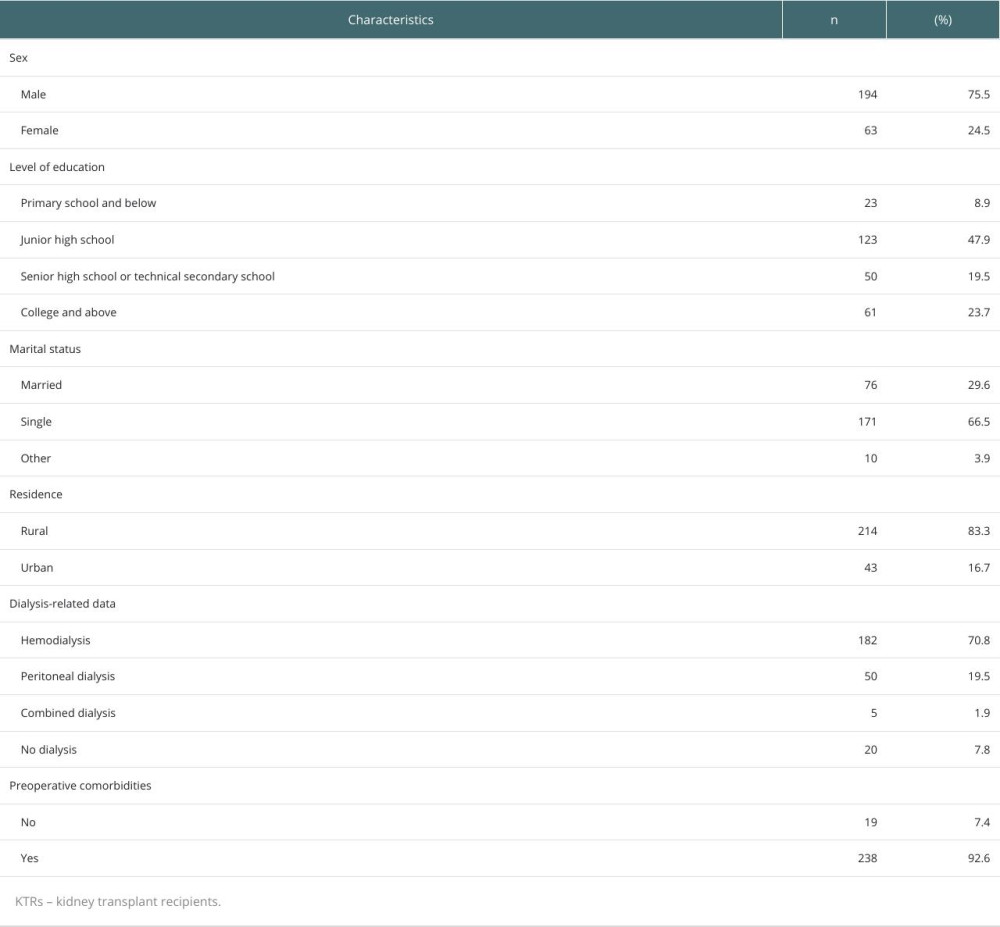 Table 2. Descriptive statistics and correlations among the PNI at the 4 measurement timepoints.
 Table 3. Indicators of fit for models with 1–3 latent classes for PNI.
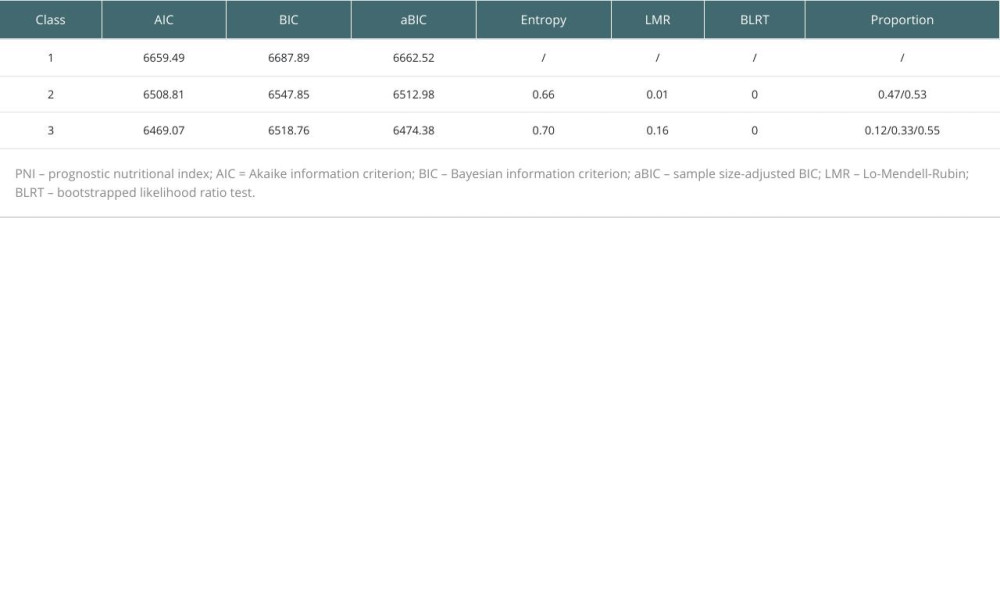 Table 4. Results of the multiple linear regression model.
References
1. Kurowski A, Assessment of health-related quality of life of patients after kidney transplantation in comparison with hemodialysis and peritoneal dialysis: Ann Transpl, 2014; 19; 576-85
2. Xie JW, Strengthening the construction of organ donation and acquisition organizations with Chinese characteristics and promoting the rapid development of organ transplantation in China: Prac J Organ Transplant (Electronic Version), 2021; 9(2); 102-4
3. Law JP, Borrows R, McNulty D, Early renal function trajectories, cytomegalovirus serostatus and long-term graft outcomes in kidney transplant recipients: BMC Nephrol, 2021; 22(1); 102
4. Hariharan S, Israni AK, Danovitch G, Long-term survival after kidney transplantation: N Engl J Med, 2021; 385(8); 729-43
5. Górska M, Kurnatowska I, Nutrition disturbances and metabolic complications in kidney transplant recipients: Etiology, methods of assessment and prevention – a review: Nutrients, 2022; 14(23); 4996
6. Turshudzhyan A, Inyangetor D, Uremic and post-transplant gastropathy in patients with chronic kidney disease and end-stage renal disease: Cureus, 2020; 12(9); e10578
7. Ahmadi S, Zahmatkesh G, Streja E, Body mass index and mortality in kidney transplant recipients: A systematic review and meta-analysis: Am J Nephrol, 2014; 40(4); 315-24
8. Santos MRO, Lasmar MF, Nascimento E, Fabreti-Oliveira RA, Impact of pretransplantation malnutrition risk on the clinical outcome and graft survival of kidney transplant patients: J Bras Nefrol, 2023; 45(4); 470-79
9. Nolte Fong JV, Moore LW, Nutrition trends in kidney transplant recipients: the importance of dietary monitoring and need for evidence-based recommendations: Frontiers in Medicine, 2018; 5; 302
10. Wang Y, Chen L, Zhang B, Pretreatment inflammatory-nutritional biomarkers predict responses to neoadjuvant chemoradiotherapy and survival in locally advanced rectal cancer: Front Oncol, 2021; 11; 639909
11. Tang Y, Li JK, Qiu T, Research progress on nutrition management of kidney transplantation recipients: Chin J Mod Nurs, 2022; 28; 2795-800
12. Zhang H, Tao Y, Wang Z, Lu J, Evaluation of nutritional status and prognostic impact assessed by the prognostic nutritional index in children with chronic kidney disease: Medicine, 2019; 98(34); e16713
13. Barutcu Atas D, Tugcu M, Asicioglu E, Prognostic nutritional index is a predictor of mortality in elderly patients with chronic kidney disease: Int Urol Nephrol, 2022; 54(5); 1155-62
14. Yu J, Chen Y, Yin M, Association between the prognostic nutritional index (PNI) and all-cause mortality in patients with chronic kidney disease: Renal Failure, 2023; 45(2); 2264393
15. Miyasato Y, Hanna RM, Morinaga J, Prognostic nutritional index as a predictor of mortality in 101,616 patients undergoing hemodialysis: Nutrients, 2023; 15(2); 311
16. Akagun T, Kavraz Tomar O, Usta M, Baylan S, COVID-19 infection in kidney transplant recipients: A single center experience: Transplant Proc, 2022; 54(6); 1424-28
17. Zhang J, Chen Y, Zou L, Gong R, Prognostic nutritional index as a risk factor for diabetic kidney disease and mortality in patients with type 2 diabetes mellitus: Acta Diabetologica, 2023; 60(2); 235-45
18. Hori S, Ichikawa K, Morizawa Y, Clinical significance of postoperative nutritional status as a prognostic factor in kidney transplant recipients: Transplant Proc, 2019; 51(6); 1763-72
19. Li B, Jiang Q, Lu Z, Application of trajectory models in longitudinal data analysis with single-outcome measurements: Chin J Intern Med, 2024; 63(9); 844-48
20. Wang M, Bi X, Ye H, Growth mixture modeling: A method for describing specific class growth trajectory: Sociological Studies, 2014; 29(04); 220-41
21. Ma H, Shen L, Zhao H, Attenuation of albumin infusion in 28 critically ill elderly patients with hypoalbuminemia: Chinese Journal of Gerontology, 2011; 31(5); 856-57
22. Chen WB: Diagnostics, 2001, Beijing, People’s Medical Publishing House
23. Chen J, Wang L, Zang Y, Influence of urinary plasmin on edema formation in adult nephrotic syndrome: Shanghai Medical Journal, 2018; 41(7); 417-23
24. Infectious Diseases Society of China, Expert consensus on interpretation of the clinical significance of infection-related biomarkers: Chin J Tubere Respir Dis, 2017; 40(4); 243-57
25. Inker LA, Titan S, Measurement and estimation of GFR for Use in clinical practice: Core curriculum 2021: Am J Kidney Dis, 2021; 78(5); 736-49
26. Fu Y, Specification for follow up after renal transplantation (2019 edition): Organ Transplantation, 2019; 10(6); 667-71
27. Huang M, Ye X, Chen L, Peng X, Developmental trajectory of campus victimization in middle school students based on Latent class growth model analysis: Chinese Mental Health Journal, 2021; 35(4); 315-20
28. Berlin KS, Parra GR, Williams NA, An introduction to latent variable mixture modeling (Part 2): Longitudinal latent class growth analysis and growth mixture models: J Pediatr Psychol, 2014; 39(2); 188-203
29. Broers NJH, Fung TY, Kooman JP, Christiaans MHL, Living-donor transplantation leads to a major improvement in physical functioning: An observational study on the impact on potential donors and their recipients: BMC Nephrol, 2019; 20(1); 109
30. Chu NM, Ruck J, Chen X, Long-term trajectories of frailty and its components after kidney transplantation: J Gerontol A Biol Sci Med Sci, 2022; 77(12); 2474-81
31. Hansen SI, Petersen PH, Lund F, Fraser CG, Plasma creatinine medians from patients partitioned by gender and age used as a tool for assessment of analytical stability at different concentrations: Clin Chem Lab Med, 2019; 58(1); 69-76
32. Ikizler TA, Burrowes JD, Byham-Gray LD, KDOQI Clinical practice guideline for nutrition in CKD: 2020 update: Am J Kidney Dis, 2020; 76(3 Suppl 1); S1-S107
33. Cheng T, Wang X, Han Y, The level of serum albumin is associated with renal prognosis and renal function decline in patients with chronic kidney disease: BMC Nephrol, 2023; 24(1); 57
34. Anderson B, Khalil K, Evison F, Hypoalbuminaemia at time of surgery is associated with an increased risk for overall graft loss after kidney transplantation: Nephrology, 2019; 24(8); 841-48
35. Lin J, Tang W, Liu W, Decreased B1 and B2 lymphocytes are associated with mortality in elderly patients with chronic kidney diseases: Front Med (Lausanne), 2020; 7; 75
36. Kim CY, Kim SY, Song JH, Usefulness of the preoperative prognostic nutritional index score as a predictor of the outcomes of lung transplantation: A single-institution experience: Clin Nutr, 2019; 38(5); 2423-29
37. Kornberg A, Kaschny L, Kornberg J, Friess H, Preoperative prognostic nutritional index may be a strong predictor of hepatocellular carcinoma recurrence following liver transplantation: J Hepatocell Carcinoma, 2022; 9; 649-60
38. Wu J, Lei W, Chinese kidney transplantation perioperative management of enhanced recovery experts consensus (2018): Chin J Transplant (Electronic Edition), 2018; 12(4); 151-56
39. Liu J, Li S, Yang J, Investigation and analysis of perioperative nutritional status among kidney transplant recipients: Journal of Nursing Science, 2020; 35(23); 91-93
40. Orazio L, Chapman J, Isbel NM, Campbell KL, Nutrition care for renal transplant recipients: An evaluation of service delivery and outcomes: J Ren Care, 2014; 40(2); 99-106
Tables
Table 1. Sociodemographic and clinical characteristics of the KTRs (n=257).Table 2. Descriptive statistics and correlations among the PNI at the 4 measurement timepoints.Table 3. Indicators of fit for models with 1–3 latent classes for PNI.Table 4. Results of the multiple linear regression model.Table 1. Sociodemographic and clinical characteristics of the KTRs (n=257).Table 2. Descriptive statistics and correlations among the PNI at the 4 measurement timepoints.Table 3. Indicators of fit for models with 1–3 latent classes for PNI.Table 4. Results of the multiple linear regression model. In Press
Original article
The Anatomical Landscape of Living Donor Livers: A 101-Case Retrospective Single-Center Study in Indonesia ...Ann Transplant In Press; DOI: 10.12659/AOT.952031
Original article
Decreased Ventilation Duration and ICU Stay Associated With Early Percutaneous Dilatational Tracheostomy Af...Ann Transplant In Press; DOI: 10.12659/AOT.953143
Original article
Immunosuppression Withdrawal in Pediatric Liver Transplant Recipients With Posttransplant Lymphoproliferati...Ann Transplant In Press; DOI: 10.12659/AOT.952021
Original article
Common Versus External Iliac Arterial Anastomosis in Kidney Transplantation: A Bicentric Retrospective Anal...Ann Transplant In Press; DOI: 10.12659/AOT.953269
Most Viewed Current Articles
24 Aug 2021 : Review article 20,864
Normothermic Machine Perfusion (NMP) of the Liver – Current Status and Future PerspectivesDOI :10.12659/AOT.931664
Ann Transplant 2021; 26:e931664
29 Dec 2021 : Original article 17,029
Efficacy and Safety of Tacrolimus-Based Maintenance Regimens in De Novo Kidney Transplant Recipients: A Sys...DOI :10.12659/AOT.933588
Ann Transplant 2021; 26:e933588
05 Apr 2022 : Original article 16,094
Impact of Statins on Hepatocellular Carcinoma Recurrence After Living-Donor Liver TransplantationDOI :10.12659/AOT.935604
Ann Transplant 2022; 27:e935604
22 Nov 2022 : Original article 16,067
Long-Term Effects of Everolimus-Facilitated Tacrolimus Reduction in Living-Donor Liver Transplant Recipient...DOI :10.12659/AOT.937988
Ann Transplant 2022; 27:e937988