16 October 2020: Original Paper
Expression of 6 Biomarkers in Liver Grafts After Pediatric Liver Transplantation: Correlations with Histology, Biochemistry, and Outcome
Silja H. Voutilainen1BCDEF*, Silja K. Kosola2BE, Jouko Lohi3BE, Aino Mutka3BE, Timo Jahnukainen4BE, Mikko Pakarinen1AEG, Hannu Jalanko4ACDEGDOI: 10.12659/AOT.925980
Ann Transplant 2020; 25:e925980


Abstract
BACKGROUND: Subclinical graft inflammation and fibrosis after pediatric liver transplantation (LT) are common. Biomarkers are needed that precede and are associated with these changes and graft outcome.
MATERIAL AND METHODS: We evaluated immunohistochemical expression of 6 biomarkers [α-smooth muscle actin (α-SMA), collagen I, decorin, vimentin, P-selectin glycoprotein ligand-1 (PSGL-1), and CD34] in biopsies taken intraoperatively at LT (baseline) (n=29) and at 11.3 years after LT (first follow-up) (n=51). Liver biochemistry and graft histology were assessed at the first follow-up and at final assessment (19.6 years after LT) (n=48). Second follow-up biopsies for histology were available from 24 patients. The immunostainings were correlated with liver histology, biochemistry, and outcome at these time-points.
RESULTS: Baseline levels of the biomarkers were unrelated to presence of fibrosis at follow-up. Increased α-SMA, collagen I levels, decorin, and vimentin were associated with simultaneous fibrosis at the first follow-up (p=0.001–0.027). Increased SMA, collagen I, decorin, vimentin, PSGL-1, and CD34 expression at first follow-up were associated with simultaneous portal inflammation (p=0.001-0.025). α-SMA, decorin, and vimentin expression were increased in patients without fibrosis at the first follow-up but who developed fibrosis in second follow-up (p=0.014 p=0.024 and p=0.024). Significant fibrosis (F2) and markedly increased α-SMA, collagen I, decorin, and vimentin levels at first follow-up were associated with suboptimal liver status at the final assessment (p=0.002–0.042).
CONCLUSIONS: The expression of the biomarkers at LT was unrelated to later development of graft fibrosis. a-SMA, decorin, and vimentin were associated with later graft fibrosis and suboptimal liver status.
Keywords: Graft Rejection, Immunohistochemistry, Liver Cirrhosis, Liver Transplantation, Adolescent, biomarkers, Biopsy, Child, Child, Preschool, Female, Fibrosis, Humans, Infant, Liver, Male
Background
Liver transplantation (LT) is a curative treatment for chronic and acute liver failure in children and adults. The long-term outcome of LT patients has improved during recent decades, with a 20-year survival currently over 80% [1]. However, serial liver biopsies have demonstrated a gradual development of graft inflammation, fibrosis, steatosis, and bile duct loss in clinically stable pediatric patients with nearly normal liver biochemistry [2–5]. The mechanism and significance of these histopathological changes remain unclear.
Thus far, few studies have evaluated the cellular and molecular mechanisms of chronic fibrosis and inflammation in liver grafts [6–11]. In this study, we focussed on 6 immunohistochemical biomarkers that cover different aspects of liver pathology. α-smooth muscle cell actin (α-SMA) is a widely used marker for activated hepatic stellate cells (HSCs), which are responsible for the over-production of extracellular matrix (ECM) components and development of fibrosis [12,13]. Type I collagen is a marker of ECM accumulation and fibrosis [14]. Decorin is an ECM protein and a natural inhibitor of the main pro-fibrotic cytokine, transforming growth factor-β1 [15]. Vimentin is expressed in activated HSCs, Kupffer cells, and endothelium and it is used as a marker of epithelial-to-mesenchymal transition [16–18]. P-selectin glycoprotein ligand 1 (PSGL-1) is an adhesion molecule expressed on several types of immune cells [19]. It has a major role in trafficking of inflammatory cells into liver sinusoids, which is an essential part of liver injury and fibrosis [20]. Finally, CD34 is an endothelial cell marker for increased neovascularization and capillarization that commonly occurs in liver injury and fibrosis [21–24].
In addition to conventional histological evaluation, immunohistochemical biomarker studies can reveal early changes at the molecular level and help to interpret histological findings. Previous studies have reported that increased α-SMA and vimentin expression measured during the first year after LT can precede development of graft fibrosis [6–11]. It has been hypothesized that α-SMA expression of the graft at the time of LT is associated with the development of fibrosis [8].
The aim of this study was to investigate the immunohistochemical expression of α-SMA, type I collagen, decorin, vimentin, PSGL-1, and CD34 as related to graft histopathology, liver biochemistry, and long-term outcome. We investigated the biomarker expression from liver biopsies taken at the time of surgery and at a median follow-up of 11.3 years after LT. The results were correlated with graft histology and biochemistry, as well as with the clinical liver status at a median time of 19.6 years after LT.
Material and Methods
PATIENTS:
Between 1987 and 2007, 99 pediatric patients (age <18) underwent deceased donor LT in Finland. All operations and most of the follow-up occurred at the Helsinki University Hospital. Data on these patients were gathered in 2009–2011, referred to here as the first follow-up, a median of 11.3 (range, 2.8–22.3) years after LT. At that time, 33 patients had died, 10 did not give consent to participate in the study, 3 had insufficient liver biopsy samples for analyses, and 2 patients underwent re-LT at that time. All 51 patients (77% of the 66 survivors) included in this study underwent percutaneous liver biopsy sampling for histology and immunohistochemistry and had blood biochemistry measurements. All patients displayed nearly stable graft function (Table 1).
In 29 of the 51 study patients, a liver graft biopsy sample taken at the time of surgery, referred to here as baseline, was available for immunohistochemical stainings.
Clinical and blood biochemistry data were gathered from 48 patients (3 patients were deceased due to causes unrelated to LT) at the final assessment (latest patient visit before November 2019), which occurred a median of 8.3 (range, 4.7–10.3) years after the first follow-up and 19.6 (range, 10.17–28.44) years after LT. Second follow-up liver biopsies, taken after the first follow-up but before October 2017, were available from 24 patients for histological evaluation. These biopsies were taken a median of 4.5 years (range, 1.1–7.3) after the first follow-up and a median of 18.9 (range, 4.8–25.4) years after the LT. Sixteen (67%) of these biopsies were taken as protocol biopsies from asymptomatic patients and 8 were taken due to suspicion of acute rejection.
STUDY DESIGN:
The timeline of the study can be seen in Figure 1. The baseline biomarker levels were correlated with the histological findings at the first follow-up. Immunohistochemical findings at the first follow-up were correlated with simultaneous graft histology and liver biochemistry. The predictive value of the biomarkers was analyzed by comparing the immunohistochemical findings at the first follow-up with histological findings of the second biopsy and liver status at the final assessment.
LIVER GRAFT BIOPSIES:
The first and second follow-up biopsies were percutaneous core needle biopsies of the liver grafts, which were taken by experienced radiologists under ultrasound guidance. Intraoperative samples at LT were surgical wedge biopsies taken before removal of the liver graft.
IMMUNOHISTOCHEMICAL ANALYSES:
Immunohistochemical stainings on formalin-fixed samples were performed as previously reported [25]. The antibodies used were as follows: 1) Collagen type 1 monoclonal antibody clone 1–8AH5 (1: 1000) (Abnova Corporation); 2) α-SMA, CD34 and vimentin antibody clones 1A4 (1: 200), QBEn10 (1: 100) and 3B4 (1: 100) (Dako Aligent Technologies), respectively; 3) Decorin polyclonal rabbit antibody clone NBP1-84970 (1: 750) (Novus Biologicals); and 4) PSGL-1 monoclonal antibody clone sc-13535 (1: 500) (Santa Cruz Biotechnology).
Immunohistochemical stainings were graded semiquantitatively without knowledge of the patients’ clinical stage. The scoring was performed according to a previously validated scoring system introduced by Chevallier et al. that was modified to correspond to the observed immunohistochemical staining patterns [26]. The staining patterns of the biomarkers at the portal areas are presented in Figure 2.
α-SMA, type I collagen, and decorin expression in portal areas were evaluated on a scale from 0 to 2 (0=mild staining restricted to portal area, 1=extended periportal staining without bridging, 2=periportal staining with bridging). Lobular expression was evaluated based on the staining of sinusoidal walls or EMC (0=absent or slight staining, 1=continuous staining, 2=intense staining). Evaluation of central areas was based on the rim around the central vein (0=none or slight rim, 1=continuous or thick rim, 2=pericentral staining). Portal, lobular, and central scores were added for an overall score of 0 to 6.
PSGL-1 and vimentin staining of portal areas were evaluated on a scale of 0 to 2 (0=absent or slight, 1=increased, 2=extended). In lobular areas, scoring was based on the number of positive cells at sinusoids (0=none or a few positive cells, 1=increased number of positive cells, 2=markedly increased number of positive cells). Central expression of PSGL-1 and vimentin were scored in a similar fashion to α-SMA, type I collagen, and decorin.
CD34 scoring was based on the number of CD34-positive sinusoids in portal (0=normal, 1=increased, 2=markedly increased) and central areas (0=absent, 1=some CD34 positive sinusoids, 2=several CD34 positive sinusoids).
GRAFT HISTOLOGY:
Graft histology was evaluated from the first and second follow-up liver biopsies stained with hematoxylin and eosin and Masson’s trichrome. First and second follow-up biopsies contained a median of 10 (7–16) and 14 (11–19) portal areas, respectively. Two pathologists with expertise in liver histopathology evaluated the histological findings unaware of the patients’ clinical status. Inflammation was graded according to the Banff criteria (grades from 0 to 3) and portal fibrosis was staged according to the Metavir staging, from mild fibrosis (F0) to cirrhosis (F4) [27,28]. Sinusoidal and central fibrosis was scored as absent or present.
CLINICAL FOLLOW-UP:
Blood tests for alanine aminotransferase (ALT), γ-glutamyl transferase (GT), total bilirubin, prealbumin, and platelet count were performed in the first follow-up and at the final assessment. At the final assessment, liver status was considered suboptimal in case of a re-transplantation, diagnosis of chronic rejection, or in case of 1 or more of the following laboratory findings: total bilirubin level over 25 μmol/L, GT over 50 U/L, ALT over 60 U/L, or thromboplastin time (TT) under 70%.
STATISTICAL ANALYSIS:
Statistical analyses were performed with SPSS 25.0 statistics software (IBM, Somers, NY). Data are presented as frequencies and percentages or as medians with interquartile range (IQR) or with range. To compare differences between groups, the Mann-Whitney U test was used for continuous variables and the Kruskal-Wallis test was used for ordinal variables. Fisher’s exact test was used to evaluate the significance of dependency between dichotomous variables. Correlations were calculated with the Spearman rho two-tailed test. Differences between 2 ordinal dependent variables (change in biomarkers expression) were calculated with the Wilcoxon signed rank test.
Only two-sided p-values were used. Two-sided p-values <0.05 were considered statistically significant.
ETHICS:
The study protocol adhered to the ethical principles of the 1975 Declaration of Helsinki. This study was approved by the Ethics Committee of Children’s Hospital, Helsinki and Uusimaa Hospital District (IRB approval number 345/13/03/03/2008). All participating patients (and in case of minors, also their parents) signed an informed consent form.
Results
BIOMARKER EXPRESSION PATTERN:
The biomarker expression at the baseline (n=29) and at the first follow-up biopsies without fibrosis (n=51) was mostly weak (score 0). At baseline, frequencies of increased staining (score >1) in the portal, lobular, and central areas were as follows: α-SMA 15–32%; type I collagen 7–22%; decorin 6–17%; vimentin 0–32%; PSGL-10–33%; and CD34 16–32%. The immunohistochemical findings at the first follow-up are presented in Table 2. The expression of the biomarkers showed no significant changes from the baseline to the first follow-up (Wilcoxon rank test p-values ranging from 0.096 to 1.00).
Of the 29 patients with follow-up biopsy, 15 had neither fibrosis nor inflammation; instead, 14 had fibrosis or inflammation or both at the first follow-up biopsy. Increased biomarker expression at baseline was not associated with these histopathological findings of the first follow-up (Fisher’s exact test p-values ranging from 0.065 to 1.00). In addition, we investigated the association of baseline expression of the biomarkers with the presence of fibrosis and inflammation separately (see below).
BIOMARKERS AND GRAFT FIBROSIS:
At the first follow-up, a median of 11.3 years after LT, 39% (20/51) of the liver specimens showed portal fibrosis, which was mild (F1) in 14/20, moderate (F2) in 4/20, and severe (F3) in 2/20 samples. Sinusoidal and central fibrosis were present in 4 (8%) and 7 (14%) biopsies, respectively. In fibrotic grafts, the levels of α-SMA and type I collagen were clearly increased in all 3 histological areas (portal, lobular, and central) (Table 2). Decorin expression was increased in lobular areas, and vimentin was increased in portal and lobular areas (Table 2). PSGL-1 and CD34 expressions were unrelated to the presence of fibrosis. The combined scores (of the 3 areas) of α-SMA, type I collagen, decorin, and vimentin were correlated with the concurrent fibrosis stage (Figure 3A–3D). The combined scores of PSGL-1 and CD34 levels showed no correlation with fibrosis stage (Figure 3E, 3F).
Of the 29 patients with baseline biopsy, 19 (66%) had no fibrosis (F0) at the first follow-up, 9 (31%) had mild fibrosis (F1), and only 1 (3%) had severe fibrosis (F3). Baseline expression of the biomarkers was unrelated to the presence of fibrosis at the first follow-up (Fishers exact test p-values ranging from 0.053 to 1.00).
Second follow-up biopsies were available from 24 out of 51 patients. Biopsies were taken at a median of 4.5 years after the first follow-up. To evaluate the ability of the biomarkers to predict development of fibrosis, we included only those patients without fibrosis (F0) at the first follow-up. Of the 24 patients with second follow-up biopsy, 15 had no fibrosis (F0) in the first follow-up biopsy. At the second follow-up, 11 of them still had no fibrosis and 4 had developed fibrosis. The portal expression of α-SMA, decorin, and vimentin was increased in these F0 biopsies of first follow-up in patients who developed fibrosis between these 2 time-points compared to those who did not (Figure 4). The expression of the other biomarkers was not associated with the development of fibrosis (Fischer’s exact test p-values ranging from 0.154 to 1.00).
BIOMARKERS AND GRAFT INFLAMMATION:
At the first follow-up, portal inflammation was present in 25% (13/51) of the biopsy samples and it was mostly mild (12/13). Portal inflammation was weakly correlated with portal fibrosis (r=0.315, p=0.024). The portal expression of α-SMA, type I collagen, decorin, vimentin, and PSGL-1 were increased in grafts with portal inflammation (Table 3). Increased CD34 staining was observed in central areas with inflammation (Table 3). The grade of portal inflammation was correlated with the combined scores (of the 3 areas) of all biomarkers: α-SMA, type I collagen, decorin, vimentin, PSGL-1, and CD34 (α-SMA r=0.433, p=0.003; type I collagen r=0.326, p=0.025; decorin r=0.318, p=0.048; vimentin r=0.399, p=0.010; PSGL-1 r=0.463, p=0.005 and CD34 r=0.445, p=0.002).
Of the 29 patients with baseline biopsy, 24 (83%) had no inflammation at the first follow-up and 5 (17%) had mild inflammation (Grade 1). Increased baseline expression of portal PSGL-1 was related to the presence of portal inflammation at the first follow-up, as all patients who had increased (≥1) portal expression of PSGL-1 at baseline had inflammation at the first follow-up (n=2), and of the 17 patients who had normal (0) portal PSGL-1 expression at baseline, 16 had no inflammation at the first follow-up (Fisher’s exact test p=0.018). Other biomarkers showed no association with the presence of portal inflammation in the first follow-up biopsies (Fisher’s exact test p-values ranging from 0.298 to 1.00).
Periportal, lobular, bile duct, or endothelial inflammation and bile duct loss were so rare (3/51, 3/51, 0/51, 0/51, and 3/51, respectively) that the associations of the 6 biomarkers were not tested.
BIOMARKERS AND CONCURRENT GRAFT FUNCTION:
The 51 patients at the first follow-up had normal or nearly normal plasma levels of ALT, GGT, total bilirubin, prealbumin, and platelets (Table 1). Patients with increased expression (≥1 at any of the 3 histological areas) of α-SMA, type I collagen, decorin, and vimentin showed slightly lower prealbumin levels than patients with normal stainings [188 (167–219) mg/L vs. 234 (205–269) mg/L p=0.001, 184 (168–218) mg/L vs. 244 (201–268) mg/L p=0.012, 178 (164–222) mg/L vs. 222 (197–258) mg/L p=0.020 and 186 (165–222) mg/L vs. 234 (212–268) mg/L p=0.003, respectively]. Also, patients with fibrosis showed lower prealbumin compared to those without fibrosis, but values were in the nearly normal range [189 (163–224) mg/L vs. 219 (184–267) mg/L p=0.036]. Patients with inflammation showed higher total bilirubin levels compared to those without inflammation, but values were in the normal range [12 (10–18) μmol/L vs. 9 (7–13) μmol/L p=0.033].
BIOMARKERS AND GRAFT OUTCOME:
At the final assessment at a median of 8.3 years after the first follow-up and a median of 19.6 years after LT, the liver status was evaluated from all 48 patients (3 patients had died due to causes unrelated to LT). The liver status was suboptimal in 12 patients: 2 had been re-transplanted, 1 patient had severe chronic rejection, and 9 patients had abnormalities in liver biochemistry. Three-quarters of the patients had completely normal findings (36/48). Moderately increased (≥1) biomarker levels at the first follow-up were not predictive of the liver status at the final assessment. Presence of significant fibrosis (F≥2) and markedly increased (≥2) scores of portal α-SMA, type I collagen, decorin, and vimentin and lobular expressions of decorin and vimentin at the first follow-up were associated with suboptimal liver status at the final assessment (Table 4). Presence of portal inflammation at the first follow-up was not associated with later liver status (Table 4).
Discussion
We analyzed the expression of 6 immunohistochemical biomarkers in liver grafts from pediatric LT patients and correlated the staining patterns and intensities with simultaneous and follow-up liver graft histopathology, biochemistry, and clinical outcome. Biomarker expression in graft biopsies taken perioperatively was not associated with later graft fibrosis. At follow-up, portal, lobular, and central α-SMA, and collagen I, lobular decorin, and portal and lobular vimentin were increased in liver grafts with fibrosis. Inflammation was associated with increased portal staining of α-SMA, collagen I, decorin, vimentin, PSGL-1, and central CD34. The expression of the biomarkers showed little correlation with liver biochemistry. Portal α-SMA, decorin, and vimentin expression was increased in patients who had no fibrosis at first follow-up but who developed fibrosis in second follow-up. Significant fibrosis (F2) and markedly increased α-SMA, collagen I, decorin, and vimentin levels at first follow-up were associated with suboptimal liver status at the final assessment.
Serial liver biopsies after pediatric LT from several centers have demonstrated gradual development of unexplained graft inflammation and fibrosis [2–5]. The histological changes seem to proceed slowly while the patients are clinically stable and liver biochemistry remains nearly normal. It is clear that more understanding of the liver allograft injury is needed. We found that the biomarker expression of the 6 fibrogenic biomarkers was moderate in grafts with little histologically-evident fibrosis. The comparison of the baseline and follow-up biopsies (at a median of 11.3 years after LT) in the same patients revealed quite similar staining patterns, indicating that the process is also slow at the molecular level.
The expression of α-SMA in liver diseases and grafts has been studied in a few reports. α-SMA is a marker of activated HSCs [12,13]. Normally, α-SMA is moderately expressed in portal, sinusoidal, and perivenular areas but increased α-SMA staining is reported in a variety of liver diseases [29]. α-SMA expression measured during the first years after LT seems to precede development of later fibrosis, but controversy exist on how well α-SMA staining correlates with concurrent fibrosis after LT [7–11,30]. In a study of 18 pediatric LT recipients, increased α-SMA expression predicted development of fibrosis during 2-year follow-up [7]. A study of 54 pediatric LT recipients showed that stronger α-SMA expression at 6 months was associated with present, 3-year, and 7-year fibrosis [8]. Increased α-SMA staining intensity at 6 months and 3 years was an independent risk factor for development of fibrosis at 7 years.
In this study, α-SMA expression was strongly correlated with the simultaneous stage of fibrosis and portal inflammation. The baseline expression of α-SMA was not associated with the histological findings a decade later. We found that the increased portal α-SMA expression of F0 biopsies after LT was associated with later development of fibrosis. This is in agreement with earlier findings of Gawrieh et al., who reported that early α-SMA expression at portal areas is associated with rapid development of fibrosis after LT [9]. α-SMA expression showed a weak correlation with serum prealbumin levels but not with other liver function values at the first follow-up. Increased portal α-SMA staining was also associated with abnormal clinical findings at the final assessment 8 years later.
Type I collagen is the main ECM component in fibrotic liver lesions [14]. Little is known about type I collagen expression in liver transplants. Abundant deposition of type I collagen at the time of Kasai procedure was associated with worse prognosis in pediatric biliary atresia patients [31]. In our study, type I collagen expression was associated with simultaneous fibrosis stage in liver transplants, as expected, but showed only a weak correlation with later abnormal liver status and was no better than conventional Metavir staging in that respect.
Decorin is an ECM protein with anti-fibrotic properties due to its negative impact on TGF-β1 [15,32]. In the liver, decorin is expressed as extracellular spot-like depositions around periportal tissue, central veins, and sinusoids. Increased decorin expression has been demonstrated in chronic hepatitis-associated fibrosis [33]. We found that the expression of lobular decorin in liver grafts was correlated with the concurrent fibrosis and inflammation at the first follow-up. Although baseline expression of decorin was unrelated to later fibrosis, the increased portal expression of decorin in F0 biopsies taken after LT was associated with development of fibrosis.
Vimentin serves as a marker for Kupffer cells, endothelial cells, and HSCs, and in epithelial- and endothelial-to-mesenchymal transition [16–18]. In addition to its main role as a part of the normal cell cytoskeleton of mesenchymal cells, it may also function in fibrogenesis and in graft rejections [34,35]. In a study of LT recipients with hepatitis C, rapid fibrosers (Metavir F3 or F4 at ≤2 years after LT) showed clearly increased vimentin expression in F0 biopsies measured during the first year after LT as compared to slow fibrosers (Metavir F0 or F1 at ≥2-year biopsy) [6]. In our study, vimentin expression was significantly increased in grafts with fibrosis or inflammation. Increased portal expression of vimentin in F0 biopsies taken after LT also was associated with later development of fibrosis. This is especially interesting because the development anti-vimentin antibodies in organ transplant patients has been associated with the development of antibody-mediated rejection [35].
PSGL-1 is involved in immune cell trafficking and regulating immune responses [36]. Blockade of PSGL-1 is hypothesized to prevent liver graft injury by inhibiting leukocyte infiltration [37,38]. In the present study, portal PSGL-1 expression was associated with concurrent subclinical portal inflammation after LT. We also found that increased portal expression of PSGL-1 at baseline (intraoperative biopsies) was related to subclinical inflammation at the first follow-up.
CD34 is an endothelial cell marker of neovascularization, frequently seen in liver fibrosis and inflammation [21–24]. In the normal liver, CD34 staining can be seen in sinusoidal endothelial cells at the periportal area, with perivenular areas being mostly negative [39]. Chronic liver diseases strongly increase the sinusoidal staining, especially around central veins [40,41]. We found a relationship between portal inflammation and CD34-positive sinusoids around central areas, which may reflect the role of CD34 in leukocyte infiltration [21].
The strength of our study is the simultaneous analysis of several biomarkers in liver grafts, the use of biopsies at baseline and a decade later, and the overall follow-up of the patients for more than 20 years after LT. The few previous studies of biomarker expression after LT (α-SMA, vimentin) did not evaluate their expression at the time of the transplantation and the follow-up times were significantly shorter than in the present study.
Limitations of the present study include the small cohort size, which is common in pediatric transplant studies. The differences in number of patients and biopsies at different time-points is another limitation. Not all patients had biopsy samples at the 3 time-points examined. Baseline and second follow-up biopsies were available from less than half of the patients. Also, unfortunately, for some stains, the level of missing data was high due to the insufficient size of biopsy samples. The retrospective nature of this cohort study and the time span of over 20 years also brings limitations, although all patients visited the study center regularly. The semiquantitative scoring of the biomarker expression used in this study predisposes to subjectivity, but unlike computer-assisted area fraction measurements, it offers better accuracy for detecting false staining results and to study the expression of specific areas separately. The chosen biomarkers represent different aspects of pathology (fibrosis, active inflammation, endothelial injury, and mesenchymal-to-epithelial transition), which is a strength but may also interfere with the results, as the main pathology of interest was fibrotic development.
Our study results suggest that the use of immunohistochemical stainings in LT patients can aid in the detection of fibrotic changes. Controlled prospective trials are needed to further evaluate the value of immunostainings in liver graft follow-up. We found that biomarker stainings clearly visualized the pathological liver graft lesions, especially fibrosis. However, conventional Masson’s trichrome staining was also sensitive in revealing fibrosis, and the immunostainings gave very little additional information. As the pathophysiology of the chronic subclinical fibrosis and inflammation in liver grafts is not known, investigations focused on profibrotic and proinflammatory molecules are needed. Evaluation of vimentin levels in chronic (antibody-mediated) rejection is also warranted.
Conclusions
Our study shows that the expression of alfa-SMA, type I collagen, decorin, and vimentin is increased in fibrotic liver grafts after LT. The portal expression α-SMA, decorin, and vimentin can reveal fibrotic changes in advance, even years after LT. However, the analysis of these 6 biomarkers in perioperative biopsies did not predict the later graft fibrosis.
Figures
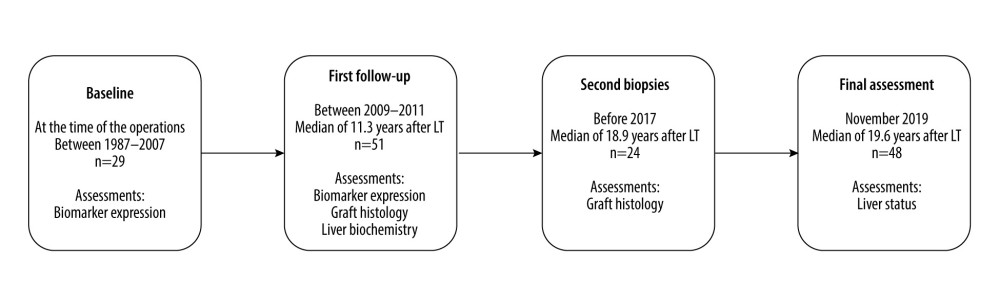 Figure 1. Study timeline. The biomarker immunostainings were performed on 29 biopsies taken intraoperatively at the LT (baseline biopsies). At the first follow-up a median of 11.3 years after LT, the biomarker expression, liver biochemistry, and histology were assessed in 51 patients. Liver biochemistry and clinical status of the liver were recorded at the final assessment at a median of 8.4 years after the first follow-up and 19.6 years after LT. Second liver biopsies taken after the first follow-up but before the final assessment were available from 24 patients.
 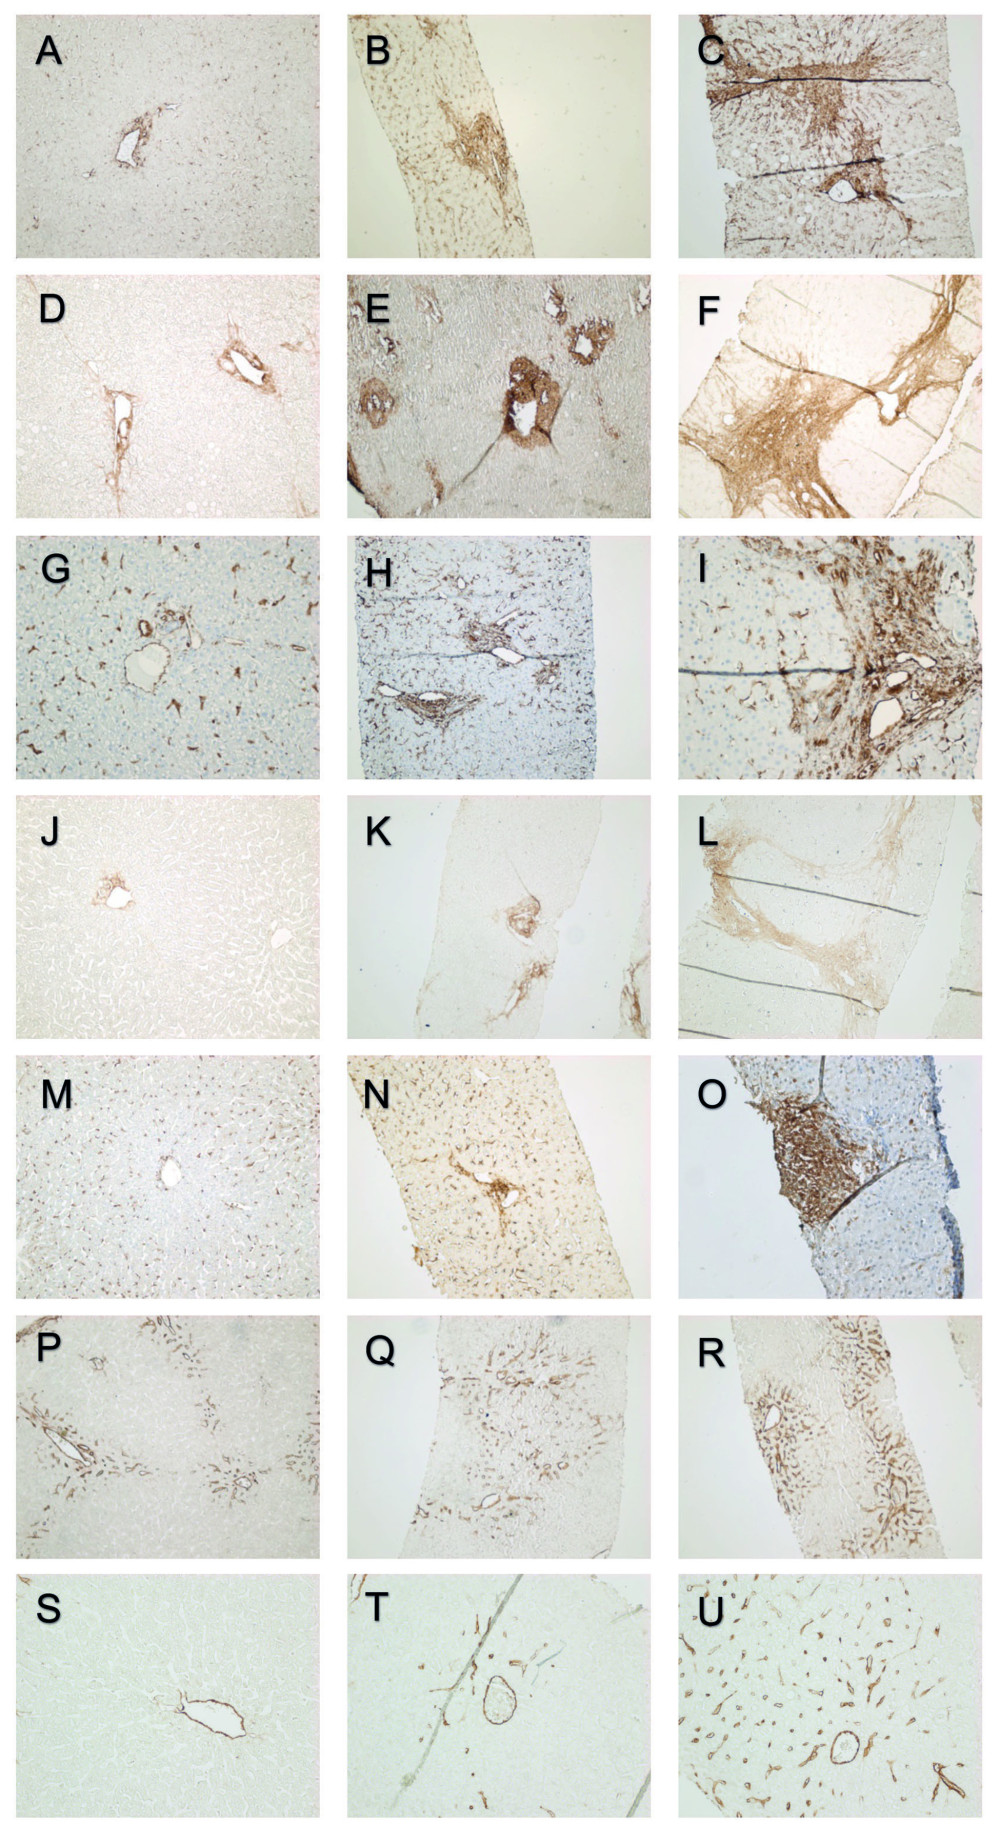 Figure 2. Portal α-SMA expression grades 0, 1, and 2 (A–C). Portal type I collagen expression grades 0, 1, and 2 (D–F). Portal vimentin expression grades 0, 1, and 2 (G–I). Portal decorin expression grades 0, 1, and 2 (J–L). Portal PSGL-1 expression grades 0, 1 and 2 (M–O). Portal CD34 expression grades 0, 1, and 2 (P–R). Central CD34 expression grades (S–U).
 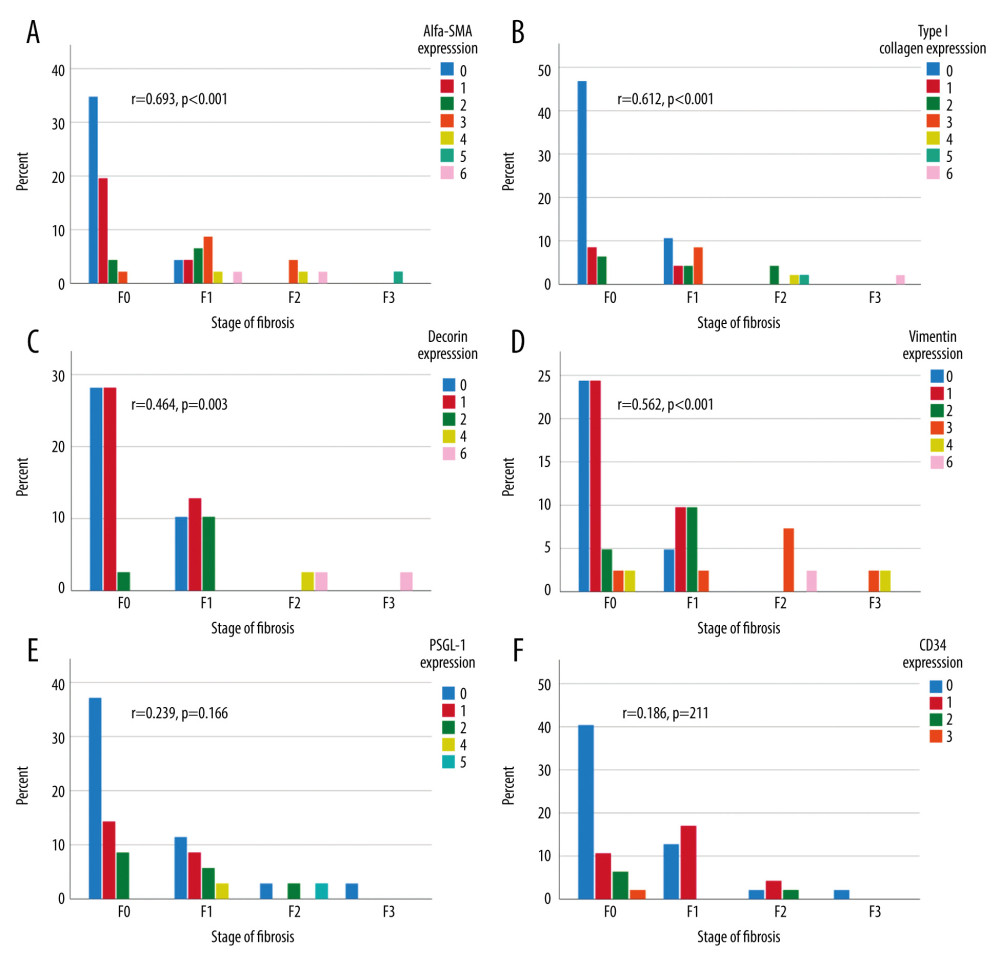 Figure 3. Combined (portal, lobular, and central) biomarker expression scores (columns) in different stages of fibrosis according to Metavir at the first follow-up (X-axis). The Y-axis presents the percentage of all patients. Correlation between immunohistochemistry grades and stage of fibrosis calculated with Spearman’s correlation, 2-tailed p-value. α-SMA expression (A), type I collagen (B), vimentin expression (C), decorin expression (D), PSGL-1 expression (E), and CD34 expression (F).
 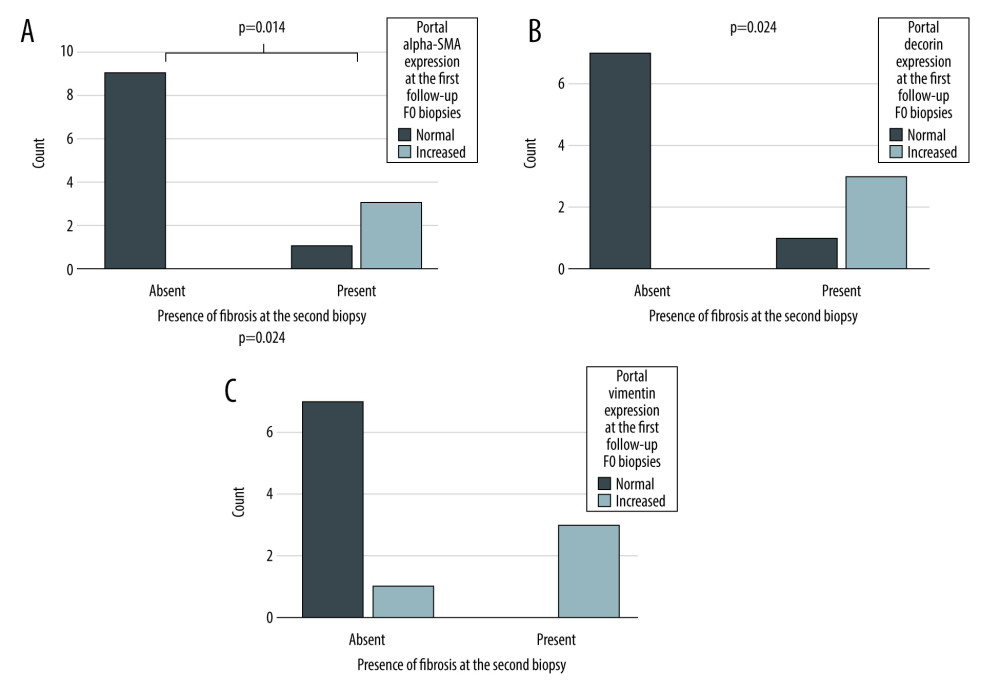 Figure 4. The expression portal α-SMA (A), decorin (B), and vimentin (C) in F0 biopsies at the first follow-up. X-axis presents the patients who still had no fibrosis (Absent) and who developed fibrosis (Present) during the follow-up (X-axis). The Y-axis presents the number of patients. P-value for the significance for dependency between portal α-SMA, decorin and vimentin expression at the first follow-up and presence fibrosis in the second follow-up biopsy calculated Fisher’s exact test.
 Tables
Table 1. Patient characteristics of all patients (n=51). Data presented as number of patients (percentage) for non-continuous variables and as median (IQR) for continuous parameters.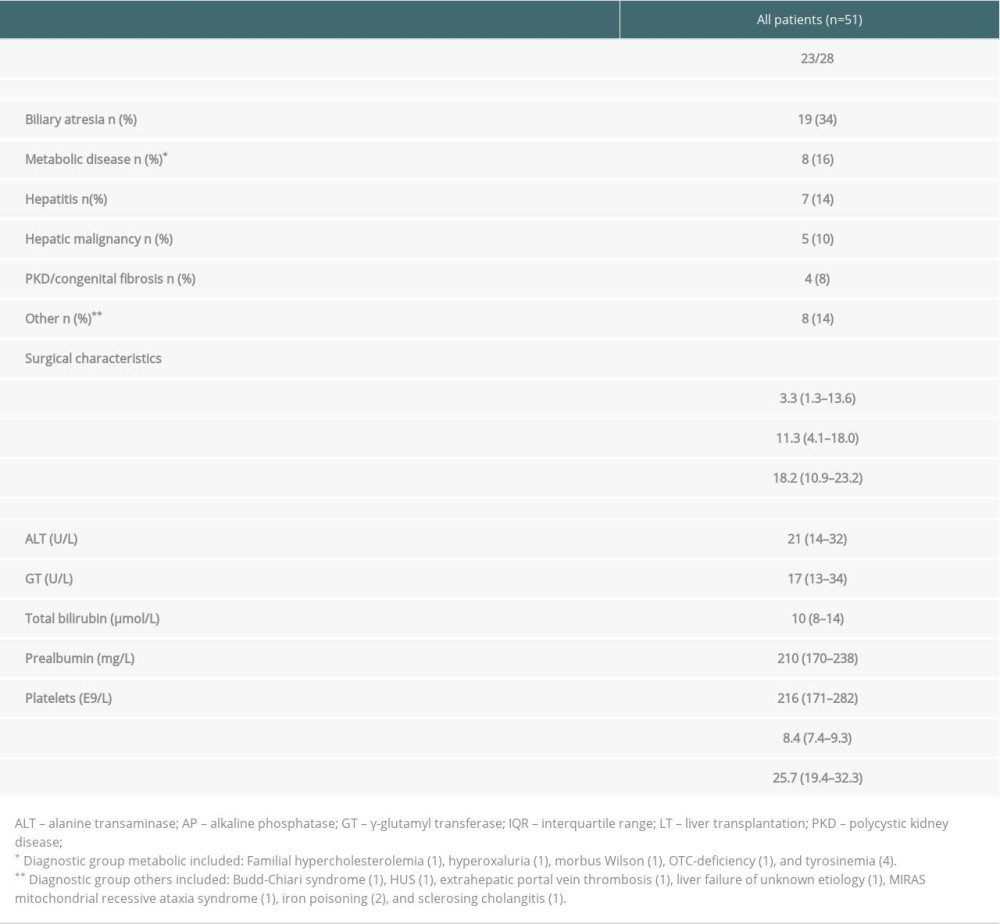 Table 2. Biomarker scores of the liver graft biopsies obtained at the first follow-up in the whole group (n=51) and in those with (n=20) and without (n=31) simultaneous fibrosis. Data are presented as number of patients in each group (percentage). Some of the biopsies were insufficient for all 6 stainings or for a reliable evaluation of the 3 histological areas. For this reason, the number of scored samples shows some variation between the different stainings.
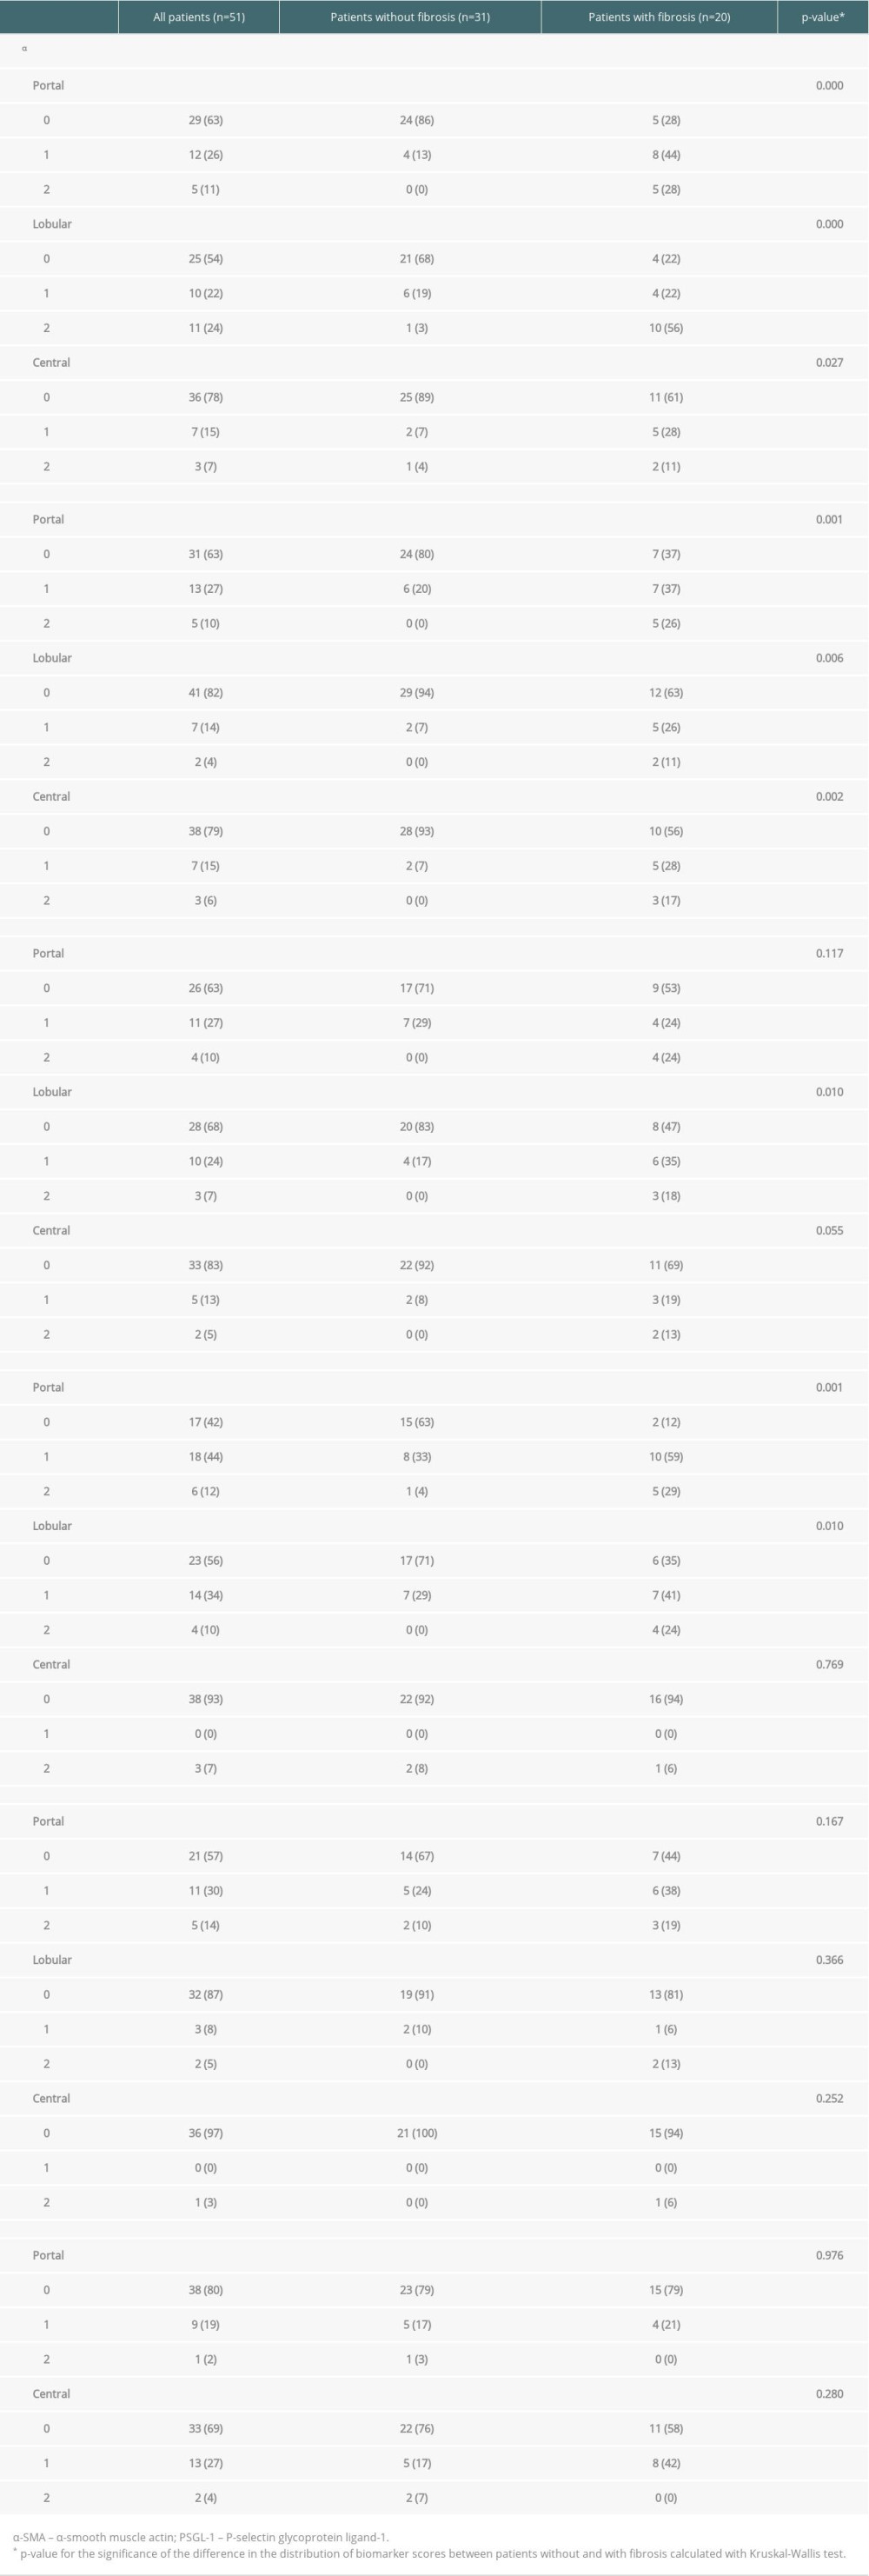 Table 3. Biomarker scores of the liver graft biopsies obtained at the first follow-up, patients divided in those with (n=13) and without (n=38) simultaneous inflammation. Data are presented as number of patients in each group (percentage). Some of the biopsies were insufficient for all 6 stainings or for a reliable evaluation of the 3 histological areas. For this reason, the number of scored samples shows some variation between the different stainings.
 Table 4. Association of any fibrosis (≥1) significant fibrosis (≥2), portal inflammation, and markedly increased (≥2) biomarker levels at first follow-up with liver status (normal in 36 and suboptimal in 12) at the final assessment. Data are presented as number of patients and percent across rows. Some of the biopsies were insufficient for all 6 stainings or for a reliable evaluation of the 3 histological areas. For this reason, the number of scored samples shows some variation between the different stainings.
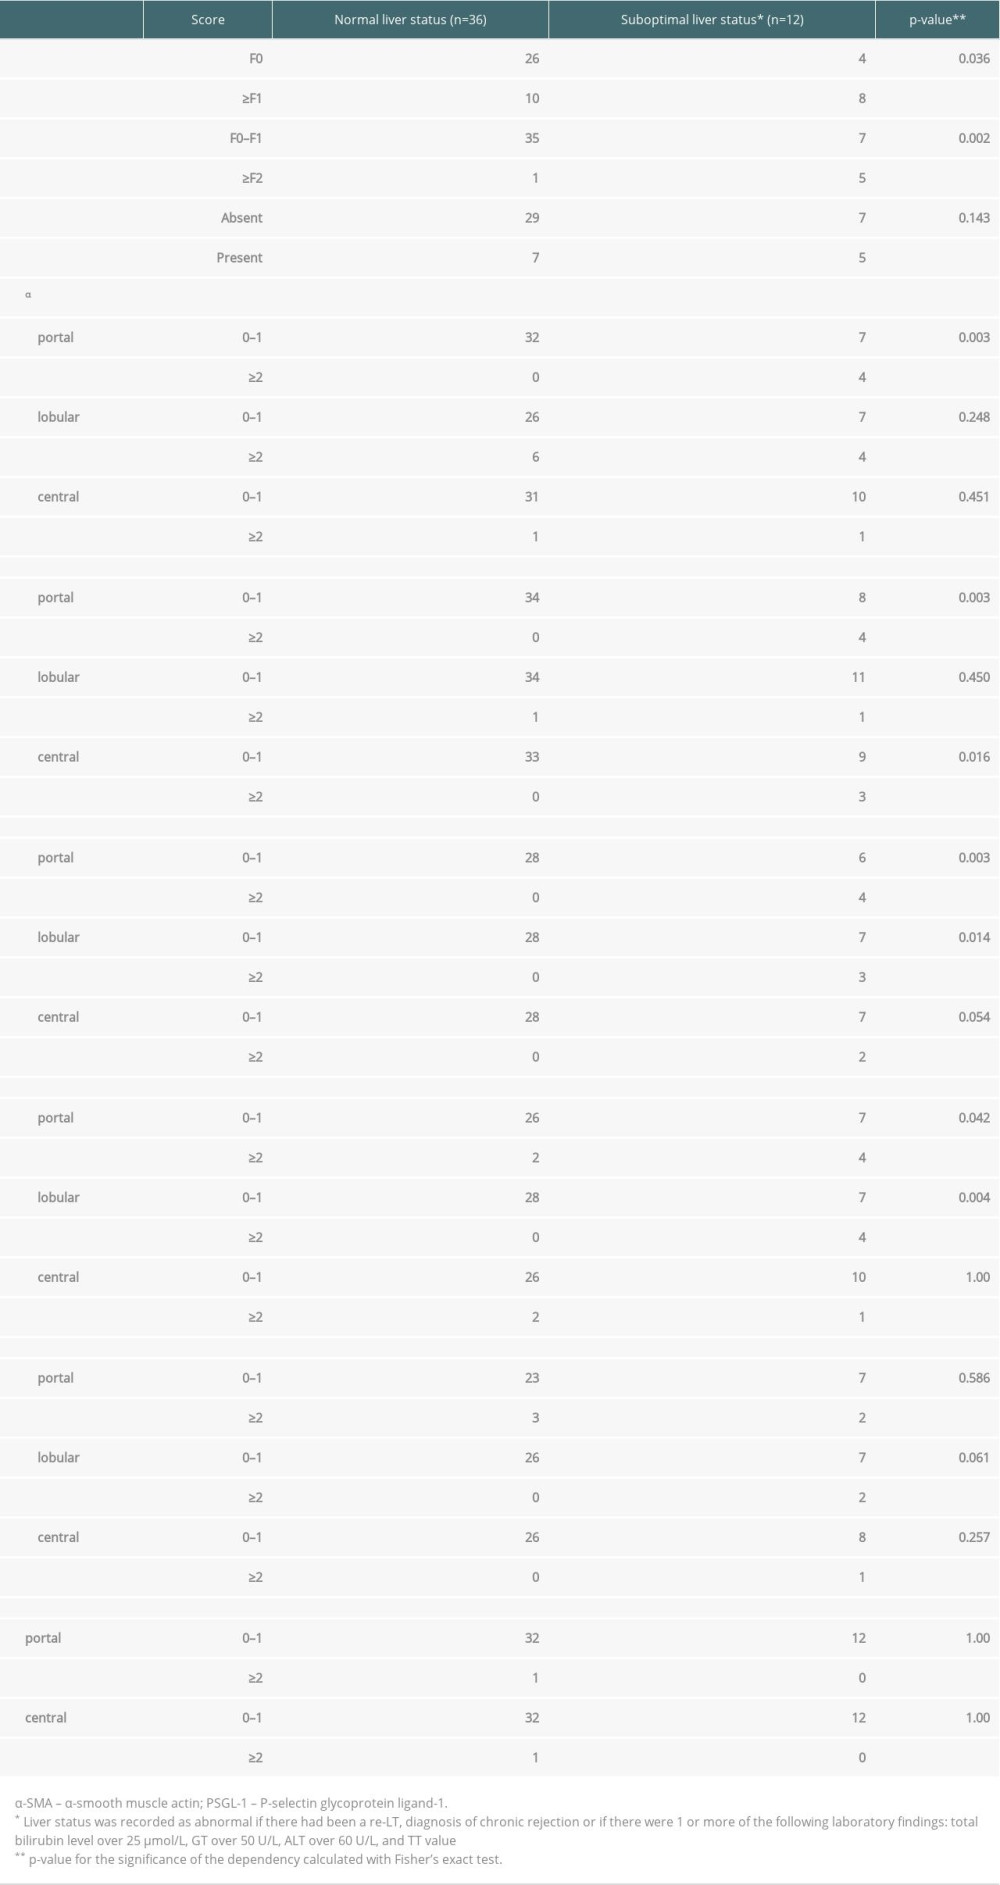
References
1. Duffy JP, Kao K, Ko CY, Long-term patient outcome and quality of life after liver transplantation: Analysis of 20-year survivors: Ann Surg, 2010; 252; 652-51
2. Kelly D, Verkade HJ, Rajanayagam J, Late graft hepatitis and fibrosis in pediatric liver allograft recipients: Current concepts and future developments: Liver Transpl, 2016; 22; 1593-602
3. Feng S, Bucuvalas JC, Demetris AJ, Evidence of chronic allograft injury in liver biopsies from long-term pediatric recipients of liver transplants: Gastroenterology, 2018; 155; 1838-51
4. Kosola S, Lampela H, Jalanko H, Low-dose steroids associated with milder histological changes after pediatric liver transplantation: Liver Transpl, 2013; 19; 145-54
5. Evans HM, Kelly DA, McKiernan PJ, Hubscher S, Progressive histological damage in liver allografts following pediatric liver transplantation: Hepatology, 2006; 43; 1109-17
6. Meriden Z, Forde KA, Pasha TL, Histologic predictors of fibrosis progression in liver allografts in patients with hepatitis C virus infection: Clin Gastroenterol Hepatol, 2010; 8; 289-96
7. Varma S, Stephenne X, Komuta M, The histological quantification of alpha-smooth muscle actin predicts future graft fibrosis in pediatric liver transplant recipients: Pediatr Transplant, 2017; 21(1)
8. Venturi C, Reding R, Quinones JA, Relevance of activated hepatic stellate cells in predicting the development of pediatric liver allograft fibrosis: Liver Transpl, 2016; 22; 822-29
9. Gawrieh S, Papouchado BG, Burgart LJ, Early hepatic stellate cell activation predicts severe hepatitis C recurrence after liver transplantation: Liver Transpl, 2005; 11; 1207-13
10. Levy MT, McCaughan GW, Marinos G, Gorrell MD, Intrahepatic expression of the hepatic stellate cell marker fibroblast activation protein correlates with the degree of fibrosis in hepatitis C virus infection: Liver, 2002; 22; 93-101
11. Russo MW, Firpi RJ, Nelson DR, Early hepatic stellate cell activation is associated with advanced fibrosis after liver transplantation in recipients with hepatitis C: Liver Transpl, 2005; 11; 1235-41
12. Friedman SL, Hepatic stellate cells: Protean, multifunctional, and enigmatic cells of the liver: Physiol Rev, 2008; 88; 125-72
13. Enzan H, Himeno H, Iwamura S, Immunohistochemical identification of Ito cells and their myofibroblastic transformation in adult human liver: Virchows Arch, 1994; 424; 249-56
14. Thompson KJ, McKillop , Schrum LW, Targeting collagen expression in alcoholic liver disease: World J Gastroenterol, 2011; 17; 2473-81
15. Yamaguchi Y, Mann DM, Ruoslahti E, Negative regulation of transforming growth factor-beta by the proteoglycan decorin: Nature, 1990; 346; 281-84
16. Niki T, Pekny M, Hellemans K, Class VI intermediate filament protein nestin is indused during activation of rat hepatic stellate cells: Hepatology, 1999; 29; 520-27
17. Prichard J, Lin F: Handbook of practical immunohistochemistry, 2011, New York, Springer
18. Liu CY, Lin HH, Tang MJ, Wang YK, Vimentin contributes to epithelial-mesenchymal transition cancer cell mechanism by mediating cytoskeletal organization and focal adhesion maturation: Oncotarget, 2015; 6; 15966-83
19. Laszik Z, Jansen PJ, Cummings RD, P-selectin glycoprotein ligand-1 is broadly expressed in cells of myeloid, lymphoid, and dendritic lineage and in some nonhematopoietic cells: Blood, 1996; 88; 3010-21
20. Mack M, Inflammation and fibrosis: Matrix Biol, 2018; 68–69; 106-21
21. Krause DS, Fackler MJ, Civin CI, May WS, CD34: Structure, biology, and clinical utility: SourceBlood, 1996; 87; 1-13
22. Sidney LE, Branch MJ, Dunphy SE, Concise review: Evidence for CD34 as a common marker of diverse progenitors: Stem Cells, 2014; 32; 1380-89
23. Elpek GO, Angiogenesis and liver fibrosis: World J Hepatol, 2015; 7; 377-91
24. Narita M, Oussoultzoglou E, Chenard MP, Liver injury due to chemotherapy-induced sinusoidal obstruction syndrome is associated with sinusoidal capillarization: Ann Surg Oncol, 2012; 19; 2230-37
25. Suominen JS, Lampela H, Heikkila P, Myofibroblastic cell activation and neovascularization predict native liver survival and development of esophageal varices in biliary atresia: World J Gastroenterol, 2014; 20; 3312-19
26. Chevallier M, Guerret S, Chossegros P, A histological semiquantative scoring system for evaluation for hepatic fibrosis in needle liver biopsy specimens: Comparison with morphometric studies: Hepatology, 1994; 20; 349-55
27. Banff working group, Banff schema for grading liver allograft rejection: an international consensus document: Hepatology, 1997; 25; 658-63
28. Bedossa P, Poynard T, An algorithm for the grading of activity in chronic hepatitis C. The METAVIR Cooperative Study Group: Hepatology, 1996; 24; 289-93
29. Schmitt-Graff A, Kruger S, Bochard F, Modulation of alpha smooth muscle actin and desmin expression in perisinusoidal cells of normal and diseased human livers: Am J Pathol, 1991; 138; 1233-42
30. Carpino G, Morini S, Ginanni Corradini S, Alpha-SMA expression in hepatic stellate cells and quantitative analysis of hepatic fibrosis in cirrhosis and in recurrent chronic hepatitis after liver transplantation: Dig Liver Dis, 2005; 37; 349-56
31. Longo-Santos LR, Teodoro WR, de Mello ES, Early type I collagen deposition is associated with prognosis in biliary atresia: J Pediatr Surg, 2016; 51; 379-85
32. Gressner AM, Weiskirchen R, Breitkopf K, Dooley S, Roles of TGF-beta in hepatic fibrosis: Front Biosci, 2002; 7; 793-807
33. Dudas J, Kovalszky I, Gallai M, Expression of decorin, transforming growth factor-beta 1, tissue inhibitor metalloproteinase 1 and 2, and type IV collagenases in chronic hepatitis: Am J Clin Pathol, 2001; 115; 725-35
34. Challa AA, Stefanovic B, A novel role of vimentin filaments: Binding and stabilization of collagen mRNAs: Mol Cell Biol, 2011; 31; 3773-89
35. Divanyan T, Acosta E, Patel D, Anti-vimentin antibodies in transplant and disease: Human Immunol, 2019; 80; 602-7
36. Tinoco R, Otero DC, Takahashi AA, Bradley LM, PSGL-1: A new player in the immune checkpoint landscape: Trends Immunol, 2017; 38; 323-35
37. Tsuchihashi S, Fondevila C, Shaw GD, Molecular characterization of rat leukocyte P-selectin glycoprotein ligand-1 and effect of its blockade: Protection from ischemia-reperfusion injury in liver transplantation: J Immunol, 2006; 176; 616-24
38. Busuttil RW, Lipshutz GS, Kupiec-Weglinski JW, PSGL-Ig for improvement of early liver allograft function: A double-blind, placebo-controlled, single-center phase II study: Am J Transplant, 2011; 11; 786-97
39. Pusztaszeri MP, Seelentag W, Bosman FT, Immunohistochemical expression of endothelial markers CD31, CD34, von Willebrand factor, and Fli-1 in normal human tissues: J Histochem Cytochem, 2006; 54; 385-95
40. Matsukuma S, Takeo H, Utsumi Y, Sato K, In hepatic venous outflow obstruction, alcoholic liver disease, and nonalcoholic fatty liver disease, centrilobular scars, CD34+ vessels, and keratin 7+ hepatocytes are in close proximity: Virchows Arch, 2017; 470; 411-20
41. Ohmori S, Shiraki K, Sugimoto K, Expression of CD34-positive sinusoidal endothelial cells in patients with HBV-associated chronic liver diseases: Int J Mol Med, 2004; 14; 179-84
Figures
Figure 1. Study timeline. The biomarker immunostainings were performed on 29 biopsies taken intraoperatively at the LT (baseline biopsies). At the first follow-up a median of 11.3 years after LT, the biomarker expression, liver biochemistry, and histology were assessed in 51 patients. Liver biochemistry and clinical status of the liver were recorded at the final assessment at a median of 8.4 years after the first follow-up and 19.6 years after LT. Second liver biopsies taken after the first follow-up but before the final assessment were available from 24 patients.Figure 2. Portal α-SMA expression grades 0, 1, and 2 (A–C). Portal type I collagen expression grades 0, 1, and 2 (D–F). Portal vimentin expression grades 0, 1, and 2 (G–I). Portal decorin expression grades 0, 1, and 2 (J–L). Portal PSGL-1 expression grades 0, 1 and 2 (M–O). Portal CD34 expression grades 0, 1, and 2 (P–R). Central CD34 expression grades (S–U).Figure 3. Combined (portal, lobular, and central) biomarker expression scores (columns) in different stages of fibrosis according to Metavir at the first follow-up (X-axis). The Y-axis presents the percentage of all patients. Correlation between immunohistochemistry grades and stage of fibrosis calculated with Spearman’s correlation, 2-tailed p-value. α-SMA expression (A), type I collagen (B), vimentin expression (C), decorin expression (D), PSGL-1 expression (E), and CD34 expression (F).Figure 4. The expression portal α-SMA (A), decorin (B), and vimentin (C) in F0 biopsies at the first follow-up. X-axis presents the patients who still had no fibrosis (Absent) and who developed fibrosis (Present) during the follow-up (X-axis). The Y-axis presents the number of patients. P-value for the significance for dependency between portal α-SMA, decorin and vimentin expression at the first follow-up and presence fibrosis in the second follow-up biopsy calculated Fisher’s exact test. Tables
Table 1. Patient characteristics of all patients (n=51). Data presented as number of patients (percentage) for non-continuous variables and as median (IQR) for continuous parameters.Table 2. Biomarker scores of the liver graft biopsies obtained at the first follow-up in the whole group (n=51) and in those with (n=20) and without (n=31) simultaneous fibrosis. Data are presented as number of patients in each group (percentage). Some of the biopsies were insufficient for all 6 stainings or for a reliable evaluation of the 3 histological areas. For this reason, the number of scored samples shows some variation between the different stainings.Table 3. Biomarker scores of the liver graft biopsies obtained at the first follow-up, patients divided in those with (n=13) and without (n=38) simultaneous inflammation. Data are presented as number of patients in each group (percentage). Some of the biopsies were insufficient for all 6 stainings or for a reliable evaluation of the 3 histological areas. For this reason, the number of scored samples shows some variation between the different stainings.Table 4. Association of any fibrosis (≥1) significant fibrosis (≥2), portal inflammation, and markedly increased (≥2) biomarker levels at first follow-up with liver status (normal in 36 and suboptimal in 12) at the final assessment. Data are presented as number of patients and percent across rows. Some of the biopsies were insufficient for all 6 stainings or for a reliable evaluation of the 3 histological areas. For this reason, the number of scored samples shows some variation between the different stainings.Table 1. Patient characteristics of all patients (n=51). Data presented as number of patients (percentage) for non-continuous variables and as median (IQR) for continuous parameters.Table 2. Biomarker scores of the liver graft biopsies obtained at the first follow-up in the whole group (n=51) and in those with (n=20) and without (n=31) simultaneous fibrosis. Data are presented as number of patients in each group (percentage). Some of the biopsies were insufficient for all 6 stainings or for a reliable evaluation of the 3 histological areas. For this reason, the number of scored samples shows some variation between the different stainings.Table 3. Biomarker scores of the liver graft biopsies obtained at the first follow-up, patients divided in those with (n=13) and without (n=38) simultaneous inflammation. Data are presented as number of patients in each group (percentage). Some of the biopsies were insufficient for all 6 stainings or for a reliable evaluation of the 3 histological areas. For this reason, the number of scored samples shows some variation between the different stainings.Table 4. Association of any fibrosis (≥1) significant fibrosis (≥2), portal inflammation, and markedly increased (≥2) biomarker levels at first follow-up with liver status (normal in 36 and suboptimal in 12) at the final assessment. Data are presented as number of patients and percent across rows. Some of the biopsies were insufficient for all 6 stainings or for a reliable evaluation of the 3 histological areas. For this reason, the number of scored samples shows some variation between the different stainings. In Press
Original article
The Anatomical Landscape of Living Donor Livers: A 101-Case Retrospective Single-Center Study in Indonesia ...Ann Transplant In Press; DOI: 10.12659/AOT.952031
Original article
Decreased Ventilation Duration and ICU Stay Associated With Early Percutaneous Dilatational Tracheostomy Af...Ann Transplant In Press; DOI: 10.12659/AOT.953143
Original article
Immunosuppression Withdrawal in Pediatric Liver Transplant Recipients With Posttransplant Lymphoproliferati...Ann Transplant In Press; DOI: 10.12659/AOT.952021
Original article
Common Versus External Iliac Arterial Anastomosis in Kidney Transplantation: A Bicentric Retrospective Anal...Ann Transplant In Press; DOI: 10.12659/AOT.953269
Most Viewed Current Articles
24 Aug 2021 : Review article 20,864
Normothermic Machine Perfusion (NMP) of the Liver – Current Status and Future PerspectivesDOI :10.12659/AOT.931664
Ann Transplant 2021; 26:e931664
29 Dec 2021 : Original article 17,029
Efficacy and Safety of Tacrolimus-Based Maintenance Regimens in De Novo Kidney Transplant Recipients: A Sys...DOI :10.12659/AOT.933588
Ann Transplant 2021; 26:e933588
05 Apr 2022 : Original article 16,094
Impact of Statins on Hepatocellular Carcinoma Recurrence After Living-Donor Liver TransplantationDOI :10.12659/AOT.935604
Ann Transplant 2022; 27:e935604
22 Nov 2022 : Original article 16,067
Long-Term Effects of Everolimus-Facilitated Tacrolimus Reduction in Living-Donor Liver Transplant Recipient...DOI :10.12659/AOT.937988
Ann Transplant 2022; 27:e937988