29 October 2024: Original Paper
Predictive Model for Post-Transplant Renal Fibrosis Using Ultrasound Shear Wave Elastography
Juan Wang1BE, Jianghong Chen2CD, Yuewei Yin3BF, Yuena Zhang1C, Yulin Ma1AG*DOI: 10.12659/AOT.945699
Ann Transplant 2024; 29:e945699


Abstract
BACKGROUND: The aim of this study was to investigate the clinical utility of ultrasound shear wave elastography (SWE) for assessment of renal fibrosis in post-renal transplant patients.
MATERIAL AND METHODS: We selected 183 patients who underwent renal transplantation. The complete dataset was randomly partitioned into a training cohort (128 cases) and a validation cohort (55 cases). All patients were subjected to SWE and renal allograft biopsy. The baseline data was compared using t-test, Z-test, or chi-square test. Through univariate and multivariate analyses, we identified independent risk factors influencing renal fibrosis after transplantation, a predictive model for post-transplant renal fibrosis was developed, and calibration curves, decision curve analyses, and ROC curves were generated.
RESULTS: Age, TST, Scr, GFR, and Emean showed significant differences (P<0.05). The C-index of the nomogram was 0.85, and the calibration curve and Hosmer-Lemeshow test demonstrated accurate diagnosis of fibrosis in both the training and validation sets (P>0.05). DCA showed that the prediction model effectively improved the diagnostic accuracy of fibrosis. The highest AUC of the nomogram for combined prediction of renal fibrosis in transplant patients was 0.902 in the training group and 0.871 in the validation group. These values were significantly higher compared to the AUCs of individual predictors (P<0.05).
CONCLUSIONS: Ultrasound SWE allows for early evaluation of renal fibrosis following transplantation. The prediction model, constructed by amalgamating other indicators, augments the accuracy and reliability of the prediction, providing more precise and accurate diagnostic and therapeutic recommendations for clinical practitioners.
Keywords: Transplantation, Ultrasound, High-Intensity Focused, Transrectal, Humans, Elasticity Imaging Techniques, Kidney Transplantation, Female, Male, Middle Aged, adult, Fibrosis, Kidney, Kidney Diseases, Risk Factors, nomograms, Postoperative Complications, Predictive Value of Tests
Introduction
Post-transplantation renal fibrosis is characterized by abnormal proliferation and deposition of fibrous tissue within the glomeruli and interstitium of the donor or recipient kidney, resulting in progressive decline in renal function [1,2]. This condition is a serious complication following kidney transplantation, with an etiology rooted in a complex interplay of factors. Studies have found a close association between the onset and progression of post-transplantation renal fibrosis and various elements, including immune reactions, vascular alterations, reperfusion injury, and drug toxicity [3,4]. Despite some progress in elucidating the mechanisms underlying post-transplantation renal fibrosis, the precise etiology remains elusive [5,6].; therefore, prevention and treatment of this condition pose considerable challenges. At present, the diagnosis of post-transplantation renal fibrosis is primarily dependent on renal biopsy, an invasive procedure with inherent risks and limitations. Consequently, there is a pressing need to devise more accurate, non-invasive diagnostic methodologies. Elastography is a non-invasive imaging technique, and shear wave velocity (SWV) and SWE are emerging non-invasive techniques for evaluating renal fibrosis, showing substantial potential in predicting this condition. These technologies assess tissue stiffness by measuring the propagation characteristics of sound waves in tissues. Specifically, SWV measures the speed of sound wave propagation, while SWE provides more detailed quantitative assessments and visual images of tissue elasticity. Studies have shown that these technologies are positively correlated with the degree of renal fibrosis, effectively distinguishing different levels of fibrosis, and the measurement results have a good correlation with histological scores. Research by Jiang et al [7] indicated a significant role for magnetic resonance imaging and ultrasound SWE in the non-invasive assessment of renal fibrosis. Similarly, Ge et al [8] developed a diagnostic model for renal fibrosis, integrating 2D ultrasound, SWE, radiomics, and clinical features. Their findings suggested that this non-invasive tool could effectively distinguish between varying degrees of renal fibrosis severity. In light of the aforementioned context, the objective of the present study was to leverage various parameters of ultrasound SWE to establish a non-invasive assessment and predictive model for post-renal transplant renal fibrosis. This model aims to facilitate early prediction and continuous monitoring of fibrosis severity in a clinical setting, thereby providing a foundation for making informed decisions regarding clinical treatments.
Material and Methods
RESEARCH OBJECT:
The study population included patients who underwent kidney transplantation at the Department of Urology in our hospital from January 2020 to April 2022. The inclusion criteria were: (1) age >18 years; (2) patients with indications for kidney transplantation who have completed the transplant surgery; (3) kidney transplant surgery completed within 1 month prior to enrollment; (4) patients consenting to undergo kidney tissue biopsy for evaluation of renal fibrosis; (5) patients who explicitly express their willingness to participate in this study and sign an informed consent form. The exclusion criteria were: (1) kidney transplant failure or perioperative death; (2) patients with severe cardiovascular disease, malignancies, severe infections, and other diseases; (3) patients with contraindications for biopsy surgery or significant risks associated with biopsy; (4) postoperative complications such as urinary obstruction, perirenal hematoma, and infection; (5) history of renal fibrosis. The cohort consisted of 183 kidney transplant patients who met the aforementioned inclusion and exclusion criteria. This study employed a random sampling method to divide the training and validation sets. Seventy percent of the total dataset, comprising 128 cases, was randomly selected as the training set, while the remaining 30% of the sample, totaling 55 cases, served as the validation set. The use of random sampling helped ensure that the training and validation sets had similar characteristic distributions, thereby enhancing the model’s generalizability and the reliability of the validation results. This study has received ethics approval from the Human Ethics Committee of the Second Hospital of Hebei Medical University, approval number 2020-R167. Informed consent was obtained from the participants and the study adhered to the guidelines outlined in the Declaration of Helsinki.
RECORD OF GENERAL INFORMATION:
We kept detailed records of the patients’ basic information upon admission, complete medical records of all study patients, and documentation of age, sex, height, weight, personal history, family history, kidney transplant time, laboratory tests including renal function indicators, and imaging examination data.
TRANSPLANTED KIDNEY BIOPSY:
Before kidney biopsy, routine screening blood tests were performed and coagulation times were recorded. After confirming the absence of contraindications for the procedure, a 16-G biopsy needle was used under ultrasound guidance to obtain 2 tissue samples for pathology examination. The revised Banff criteria of 2018 were used to assess the pathology findings of the biopsy tissue. In the Banff quantification score, cortical fibrosis (ci) and tubular atrophy (ct) are the pathology parameters for evaluating fibrotic changes in the transplanted kidney. According to interstitial fibrosis/tubular atrophy (IFTA) scoring, based on ci and ct, the degree of fibrosis is categorized into levels 0 to III. Mild fibrosis corresponds to IFTA levels 0 to I, while moderate to severe fibrosis pertains to IFTA levels II to III.
ROUTINE ULTRASOUND AND ULTRASOUND SWE: Patient were positioned in a supine position before the examination, and a routine ultrasound examination was performed. The SuperSonicImagine AixPlorer color Doppler ultrasound diagnostic device with an SC6-1 probe was used for the ultrasound examination. During the routine ultrasound examination, parameters such as the size, parenchymal thickness, echogenicity of the transplanted kidney, and color flow grading of the transplanted kidney were recorded. Subsequently, the SC15-4 linear array probe was used to measure the peak velocity and resistance index of the renal arcuate artery of the transplanted kidney. In the elasticity imaging mode, preparation included ensuring the probe is at a vertical angle with the scanning site, fixing the position, and instructing patients to breathe calmly and hold their breath. On the selected maximum longitudinal section of the transplanted kidney, a sample box with the system’s default maximum value (2cm × 2cm sector) was placed in the mid-cortical area of the transplanted kidney. The image was frozen and stored after observing the stability of the elastography image (5–6 frames). Elasticity measurement was considered satisfactory when the colored fill area within the sample box reached 80% or more. If the colored fill area within the sample box was less than 80% or there was significant noise, the elasticity measurement was considered unsuccessful. The Q-BOX was activated, and the region of interest with a diameter of 10 mm was placed in the cortical area of the transplanted kidney. The elastography scale was preset to display in kPa, with a range fixed at 0–80 kPa. In the color coding, blue indicated relatively softer tissue, while red indicated relatively harder tissue. SWE values were stored and recorded, and the above steps were repeated 3 times for measurement, calculating the average value (Emean) as shown in Figure 1. All ultrasound examinations were performed by a single professionally trained investigator. The SWE assessment method in this study followed the guidelines for shear wave elastography imaging published by the European Federation of Societies for Ultrasound in Medicine and Biology (EFSUMB) [9].
STATISTICAL ANALYSIS:
Statistical analysis was performed using R software. Baseline data that followed a normal distribution are presented as mean±standard deviation (mean±SD). Non-normally distributed continuous data are presented as median. Categorical data are presented as counts. Comparisons were made using t-tests, Z-tests, or chi-square tests. Logistic single-factor and multi-factor analyses were conducted to identify independent risk factors influencing renal fibrosis in transplantation. Based on the independent risk factors, a predictive nomogram for renal fibrosis in transplantation was constructed. Calibration curves were plotted to compare the predicted values from the nomogram with the actual observed values. Decision curve analysis (DCA) was performed to assess the utility of the model. Receiver operating characteristic (ROC) curves were plotted to calculate the area under the curve (AUC) for each independent risk factor and the nomogram in the training and validation sets. A difference was considered statistically significant at
Results
COMPARISON OF BASELINE DATA BETWEEN TRAINING GROUP AND VERIFICATION GROUP:
This study included a total of 183 patients, consisting of 74 males and 99 females, with a mean age of 42.81±2.17 years. The time since transplantation (TST) was 17 (5, 41) months. Among the included patients, 57 were diagnosed with renal fibrosis after transplantation based on the pathology results of renal biopsies. Of these, 41 patients were in the training set, while 16 patients were in the validation set. No significant differences in baseline characteristics were observed between the 2 groups, and these differences were not statistically significant (P>0.05) (Table 1).
SINGLE AND MULTIVARIATE ANALYSIS OF TRAINING GROUP:
Univariate and multivariate analyses were performed on the patients in the training group, revealing that several independent risk factors significantly influenced renal fibrosis after transplantation. These factors were age, TST, Scr, GFR, and Emean. The statistical analysis indicated that all of these differences were statistically significant (P<0.05) (Table 2).
INFLUENCE OF INDEPENDENT RISK FACTORS ON THE RENAL FIBROSIS AFTER TRANSPLANTATION:
To further compare the influence of each independent risk factor on renal fibrosis after transplantation patients, Kaplan-Meier survival curves of each independent risk factor were drawn for the training group and the validation group, respectively (Figures 2, 3), and the differences in each group were statistically significant by log-rank test (P<.001).
NOMOGRAM CONSTRUCTED BASED ON THE RESULTS OF ULTRASOUND SWE IN THE TRAINING GROUP:
A nomogram was constructed based on the independent risk factors identified through multivariate analysis. Each independent risk factor is represented by a numerical value on the nomogram, and the values of all independent risk factors were summed to obtain the total points. Based on the total points, the probability of renal fibrosis in transplant patients was calculated. The consistency of the nomogram was indicated by a C-index of 0.85 (95% CI, 0.67–0.83) (Figure 4).
ROC CURVE, CALIBRATION CURVE AND DCA DECISION CURVE OF NOMOGRAM:
The receiver operating characteristic (ROC) curve of the nomogram (Figure 5) demonstrated that the area under the curve (AUC) values for both groups at each time point were above 0.70, showing the model’s robust predictive ability for renal fibrosis in transplant patients. Examination of the calibration plot curves for the 1-year, 3-year, and 5-year predictions revealed good agreement between the predicted survival rates from the nomogram and the actual survival rates. The points on the calibration curve tightly clustered along the diagonal line, indicating a high level of accuracy in the model’s predictions. Furthermore, the Hosmer-Lemeshow test results indicated no significant disparity (P>0.05) between the diagnostic outcomes of renal fibrosis in the training group and the validation group, thus demonstrating good consistency. This suggests that the model has exceptional prediction accuracy (Figure 6). Lastly, to assess the practical utility of the prediction model in clinical decision-making, decision curve analysis (DCA) was conducted (Figure 7). Within a specific threshold range, the nomogram showcased a favorable net clinical benefit, underscoring its strong clinical validity.
PREDICTIVE EFFICACY ANALYSIS OF INDEPENDENT RISK FACTORS AND NOMOGRAM FOR PREDICTING RENAL FIBROSIS IN RENAL TRANSPLANT RECIPIENTS:
The AUC values for predicting renal fibrosis in transplant kidney patients in the training group using the indicators age, TST, Scr, GFR, Emean, and nNomogram were 0.637, 0.677, 0.628, 0.702/0.724, and 0.902, respectively. In the validation group, the AUC values for the same indicators were 0.629, 0.679, 0.644, 0.711, 0.720, and 0.871, respectively. The highest AUC for predicting renal fibrosis in transplant kidney patients using the nomogram in the training group was 0.902, and in the validation group it was 0.871. These values were significantly higher than the AUC values obtained from each individual indicator (P<0.05) (Table 3).
Discussion
Ultrasound SWE is an imaging modality that evaluates the mechanical attributes of tissues [10,11]. Numerous studies have delved into the use of ultrasound SWE for assessing renal fibrosis in transplant recipients [12–14]. These investigations revealed that ultrasound SWE can yield insights into the elasticity of transplanted renal tissue, thereby facilitating the evaluation of fibrosis severity. Through the application of elastography to transplanted kidneys, fibrosis can be detected and quantified non-invasively, aiding clinicians in monitoring renal function and predicting transplant outcomes. The literature suggests that ultrasound SWE has potential clinical applicability in evaluating renal fibrosis in transplant recipients [15]., but obstacles remain, including the need for standardization of imaging techniques and establishment of unified criteria for interpreting imaging outcomes [16]. Additionally, further validation of the accuracy and reliability of ultrasound SWE in assessing renal fibrosis in transplant recipients is warranted. Consequently, this study endeavored to construct a predictive model for renal fibrosis, predicated on ultrasound SWE results, with the intent to augment the precision of fibrosis prediction in transplanted kidneys.
Possible risk factors for renal fibrosis in kidney transplantation include age, transplantation time, impaired renal function, hypertension, and diabetes [17]. Among these factors, hypertension emerges as a significant risk factor for renal fibrosis in transplantation [18]. Prolonged hypertension can damage the kidneys, thereby fostering fibrosis. Similarly, diabetes is a risk factor for chronic kidney disease and fibrosis [19]. Elevated blood glucose levels can impair the kidneys and contribute to fibrosis in the glomeruli and renal tubules. Taking these factors into account, this study examined potential factors influencing renal fibrosis in transplant patients through univariate and multivariate analyses. The findings revealed that age, TST, Scr, GFR, and Emean were independent risk factors for renal fibrosis in transplant patients. Notably, age and transplantation time are irreversible factors, with advancing age and prolonged transplantation time heightening the risk of renal fibrosis. Previous studies have demonstrated that elevated Scr in transplant patients amplifies the risk of renal fibrosis [20]. Impaired renal function and elevated levels of serum creatinine can impair the glomeruli and renal tubules, thereby promoting fibrosis. Sun et al [21] also integrated Scr into their predictive model for lupus nephritis fibrosis, and their results are in agreement with the results of the present study. Reduced GFR signifies declining renal function and can damage the glomeruli and renal tubules, accelerating the progression of fibrosis. Furthermore, factors such as chronic rejection, acute rejection, hypertension, and diabetes can also contribute to decreased GFR and foster fibrosis. Chen et al [22] also incorporated GFR into their predictive model for fibrosis in patients with chronic kidney disease, and their findings agree with the present study. The study by Chhajer et al [23] demonstrated that ultrasound SWE can serve as an evaluative index for transplant renal fibrosis, further substantiating the importance of Emean.
Based on the results of the above studies, this study constructed a nomogram featuring the independent risk factors – age, TST, Scr, GFR, and Emean – that impact renal fibrosis in transplant patients. The nomogram achieved a C-index of 0.85. The results of the Hosmer-Lemeshow test for the validation and training groups indicated high accuracy in diagnosing transplant renal fibrosis. Furthermore, decision curve analysis demonstrated that the nomogram significantly improved the accuracy of diagnosing transplant renal fibrosis in both the training and validation groups. Finally, we also plotted the ROC curves for age, sleep time, creatinine, glomerular filtration rate (GFR), Emean, and the nomogram to predict renal fibrosis in transplant patients. The results showed that the nomogram had an AUC of 0.819 in the training group and 0.808 in the validation group, which was significantly higher than the AUCs of individual predictors. In conclusion, the nomogram constructed in this study has practical value, as it provides an effective reference for the prevention and treatment of transplant renal fibrosis. Clinically, this nomogram can guide decision-making by offering a personalized risk assessment tool. It allows healthcare professionals to quantify the risk of renal fibrosis based on individual patient data, leading to more tailored and proactive management strategies. By integrating multiple risk factors into a single predictive model, the nomogram enhances the ability to identify high-risk patients early and adjust treatment plans accordingly, ultimately improving patient outcomes and optimizing resource allocation in clinical practice.
This study developed a predictive model for transplant renal fibrosis based on ultrasound SWE results, and identified age, TST, Scr, GFR, and Emean as independent risk factors for transplant renal fibrosis. However, this study did not establish standardized imaging methods and uniform criteria for interpretation, and further validation on a larger scale is needed to assess its accuracy and reliability. Chen et al [22] used SWE to construct a nomogram for assessing renal fibrosis in chronic kidney disease patients, finding that the SWE-based nomogram provided better model fitting compared to models relying solely on clinical risk factors. Additionally, decision curve analysis further confirmed its clinical utility. These findings are similar to those of our study. Raynaud et al [24] applied artificial intelligence for dynamic prediction, enhancing the accuracy of risk stratification for kidney graft survival in transplant recipients and aiding clinical decision-making. This research outcome will also be a future direction for our group. In future research, the model can be expanded to include more biomarkers and consider lifestyle and environmental factors. Machine learning techniques can be utilized to optimize the model’s predictive capability, and methods such as cross-validation can be employed to strengthen the assessment of model stability. Furthermore, multi-center external validation should be conducted to ensure the model’s universal applicability. Simultaneously, a unified standard for ultrasound imaging should be established, jointly developed and optimized by multidisciplinary teams. Data management should be enhanced, leveraging big data technologies to mine potential predictive factors. A long-term follow-up mechanism should be established to evaluate the model’s long-term effectiveness and optimize it based on feedback. Patient education should be strengthened to improve self-management abilities, and policy support should be sought to promote the medical application of new technologies. These measures will contribute to achieving more precise assessment of transplant renal fibrosis and provide personalized medical services for patients.
Conclusions
In summary, this study found that ultrasound SWE can assess transplant renal fibrosis at an early stage, and the nomogram predictive model constructed using age, TST, Scr, and GFR can improve the accuracy and reliability of predictions, providing clinicians with more accurate and precise diagnostic and treatment recommendations.
Figures
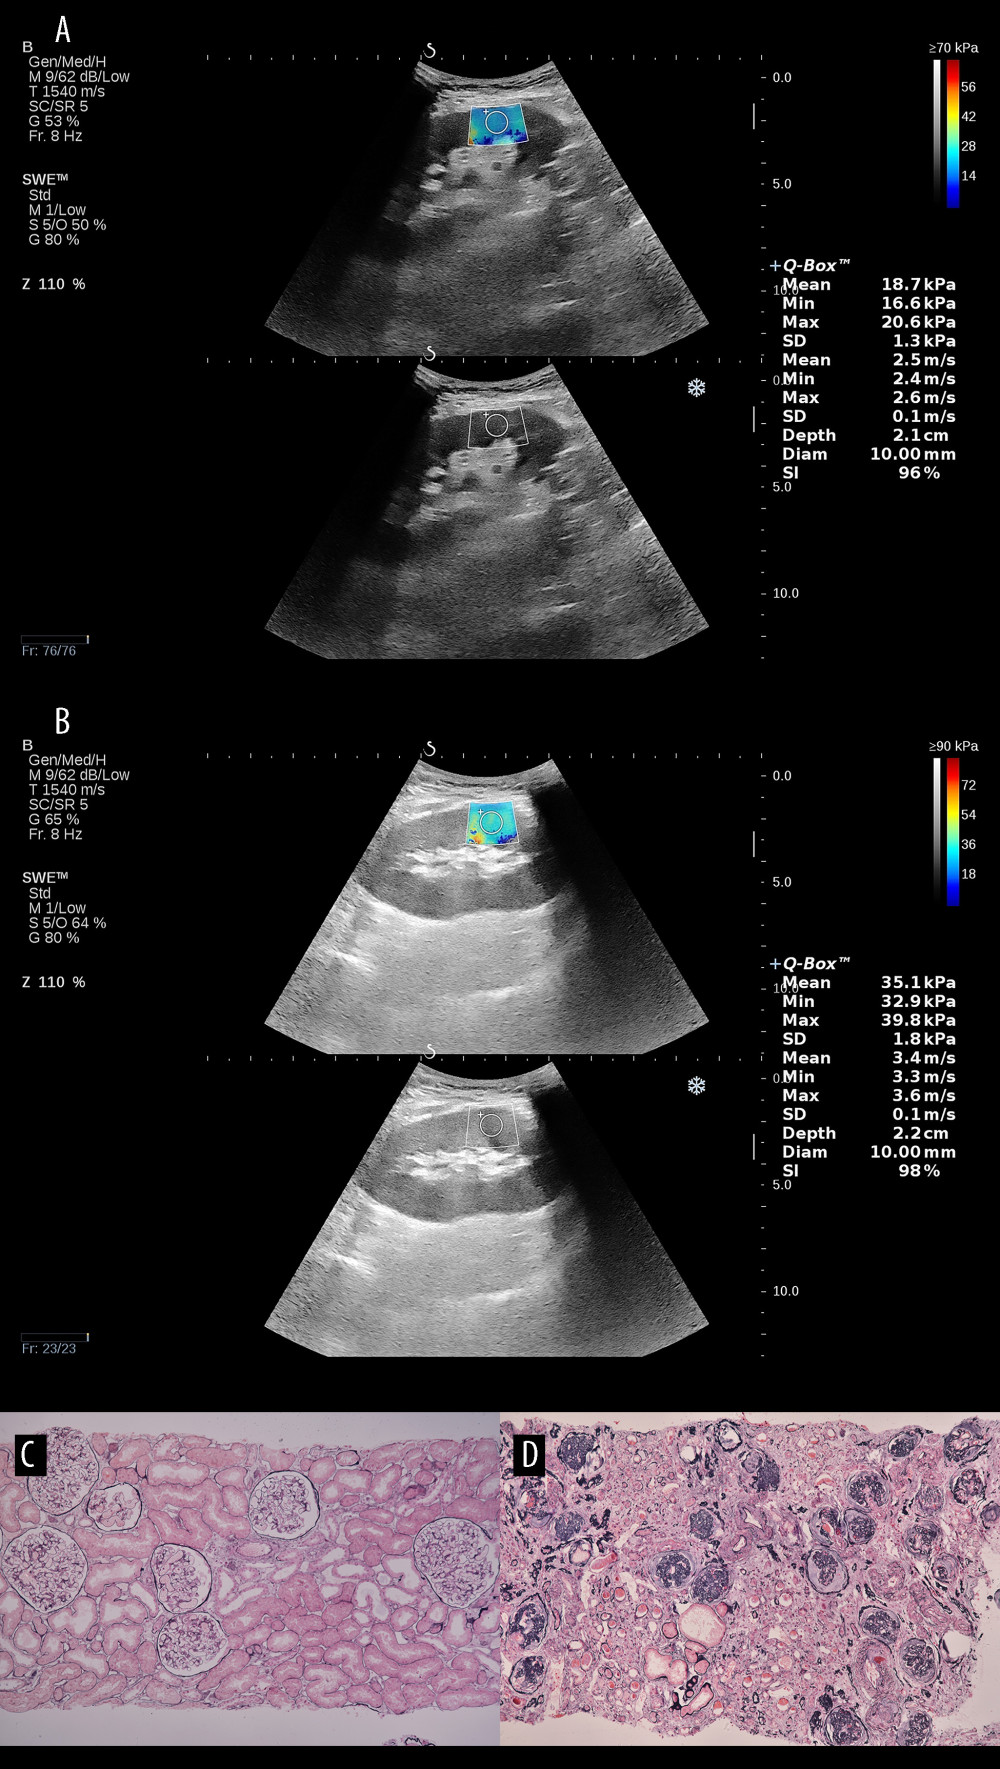 Figure 1. Comparison of ultrasound elastography and pathology findings between normal renal tissue and fibrotic renal tissue. (A) Shear wave elastography value of 18.7 kPa in normal renal tissue of the transplant kidney. (B) Shear wave elastography value of 35.1 kPa in severely fibrotic renal tissue of the transplant kidney. (C) Pathology result of normal renal tissue in the transplant kidney. (D) Pathology result of severely fibrotic renal tissue in the transplant kidney (Adobe Photoshop, 2022, Adobe, Inc.).
 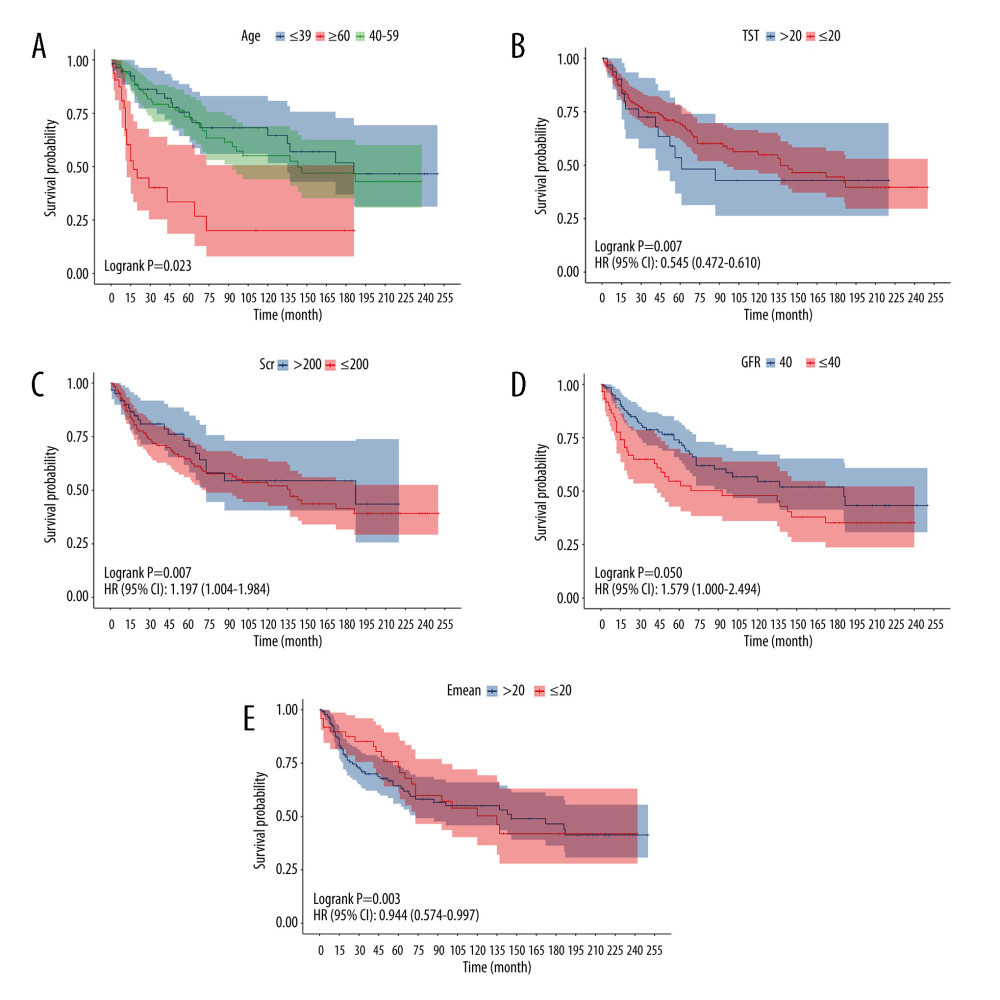 Figure 2. Kaplan-Meier survival curve of training group, age (A), TST (B), Scr (C), GFR (D), Emean (E) (R program, Version 4.2.3, R Foundation for Statistical Computing).
 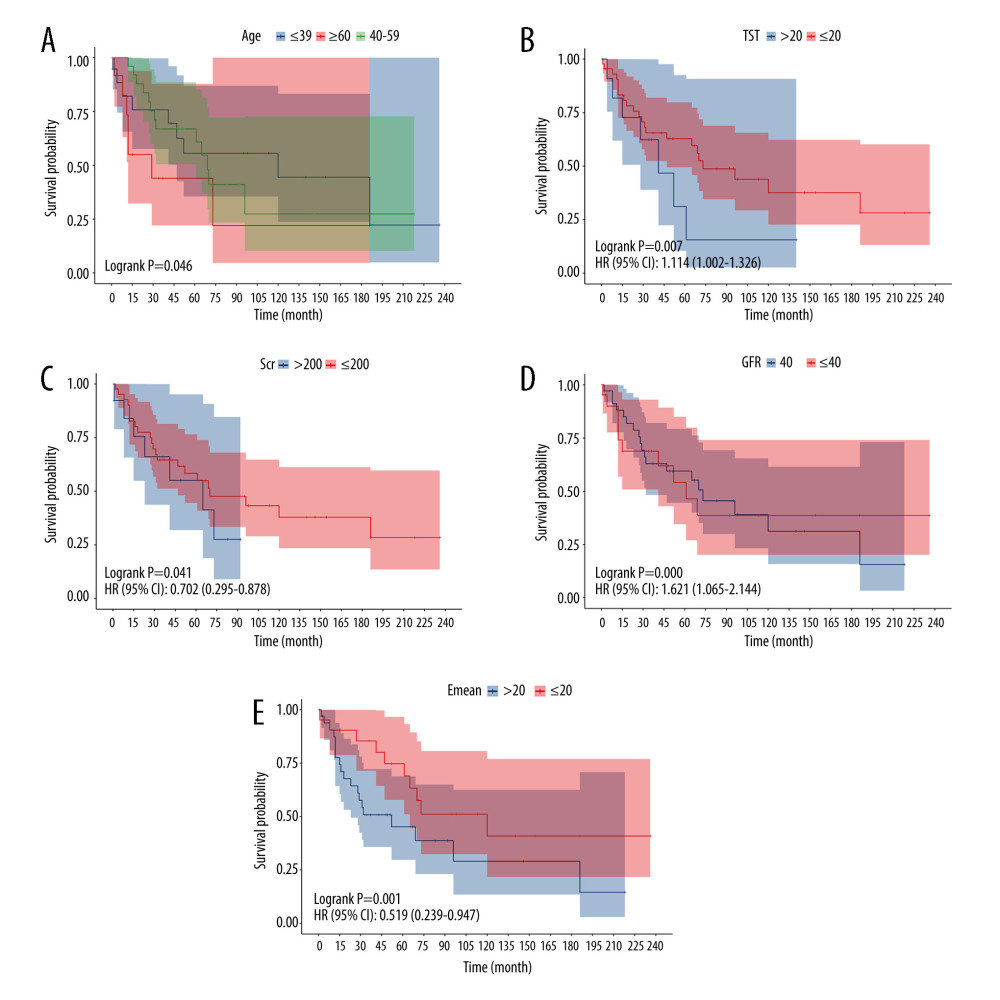 Figure 3. Kaplan-Meier survival curve of validation group, age (A), TST (B), Scr (C), GFR (D), Emean (E) (R program, Version 4.2.3, R Foundation for Statistical Computing).
 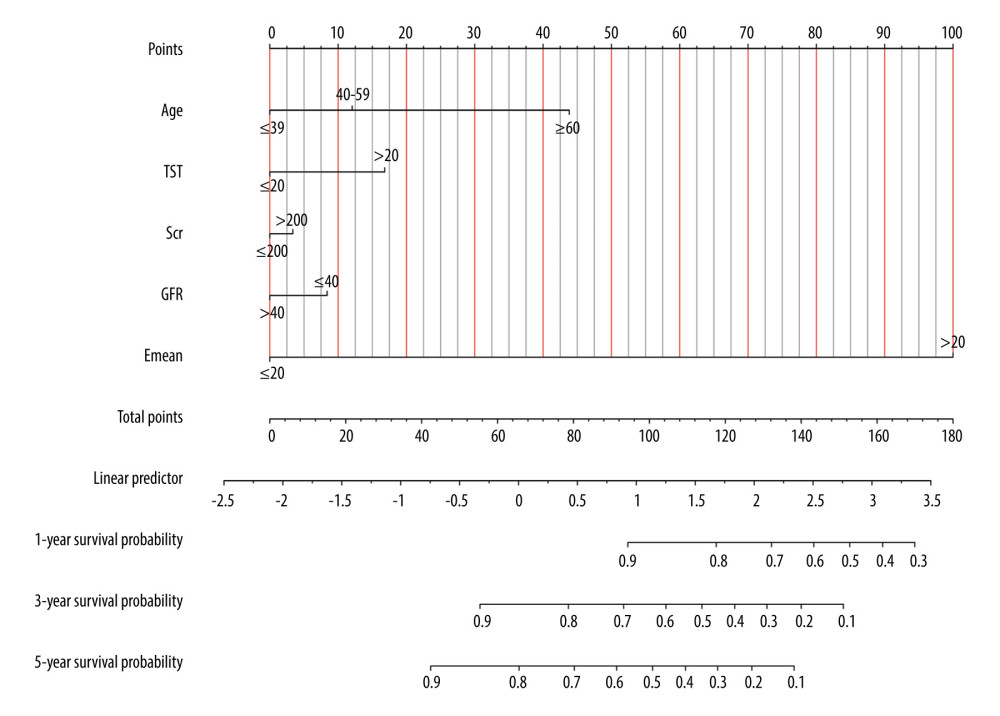 Figure 4. Prediction results of nomogram for renal fibrosis in renal fibrosis after transplantation (R program, Version 4.2.3, R Foundation for Statistical Computing).
 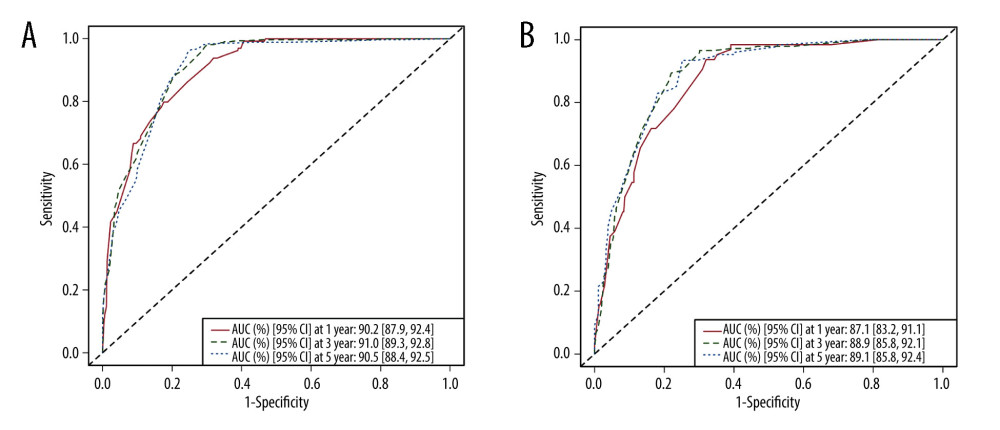 Figure 5. Area under the ROC curve (AUC) of 1-, 3-, 5-year in the training group (A) and validation group (B) (R program, Version 4.2.3, R Foundation for Statistical Computing).
 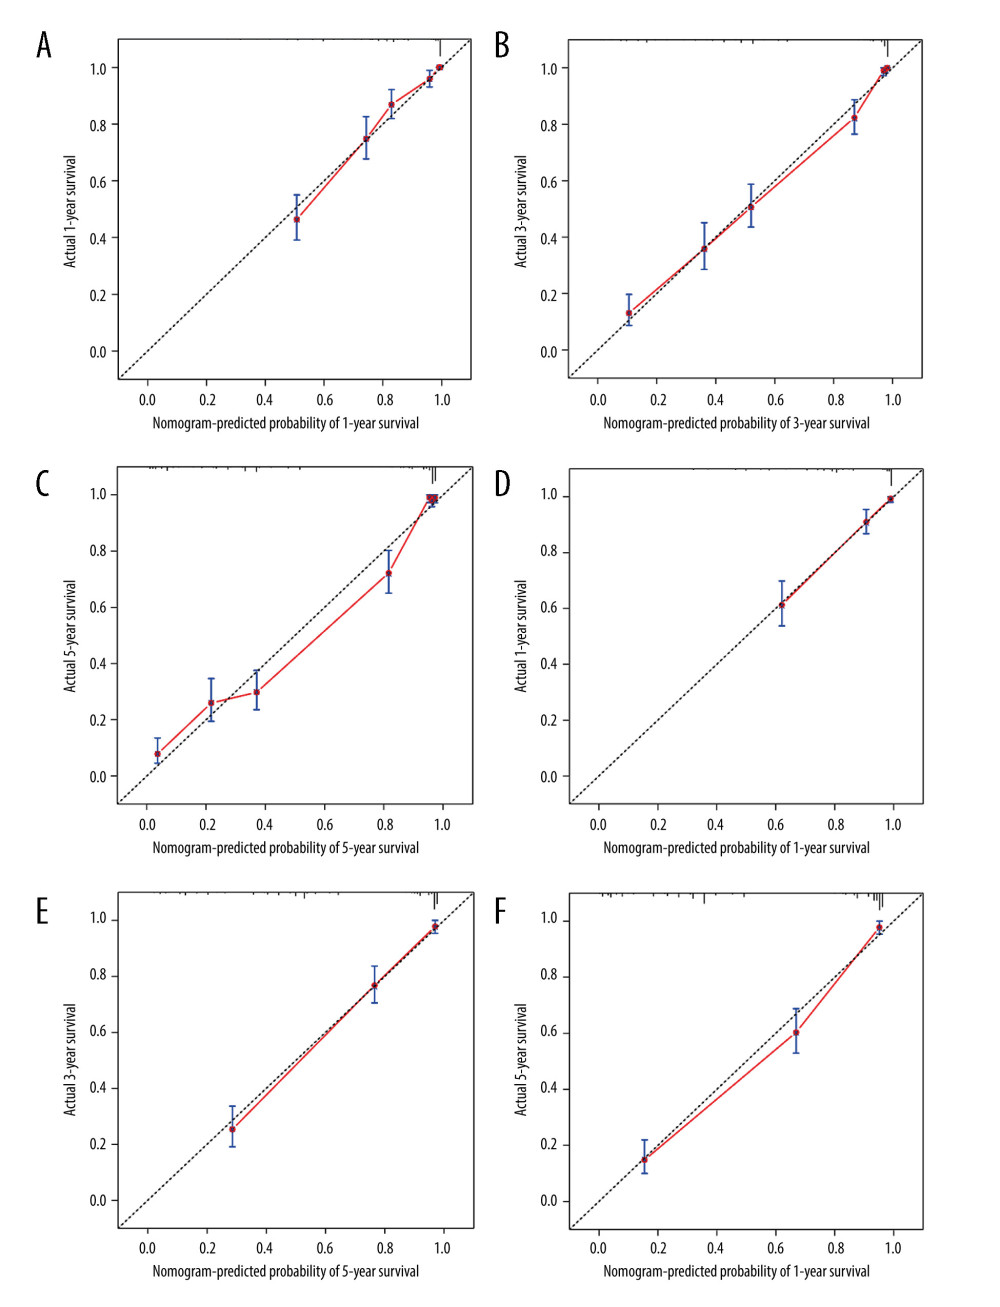 Figure 6. The calibration curves for the nomogram of 1-, 3-, 5-year in the training group (A-C) and validation group (D-F) (R program, Version 4.2.3, R Foundation for Statistical Computing).
 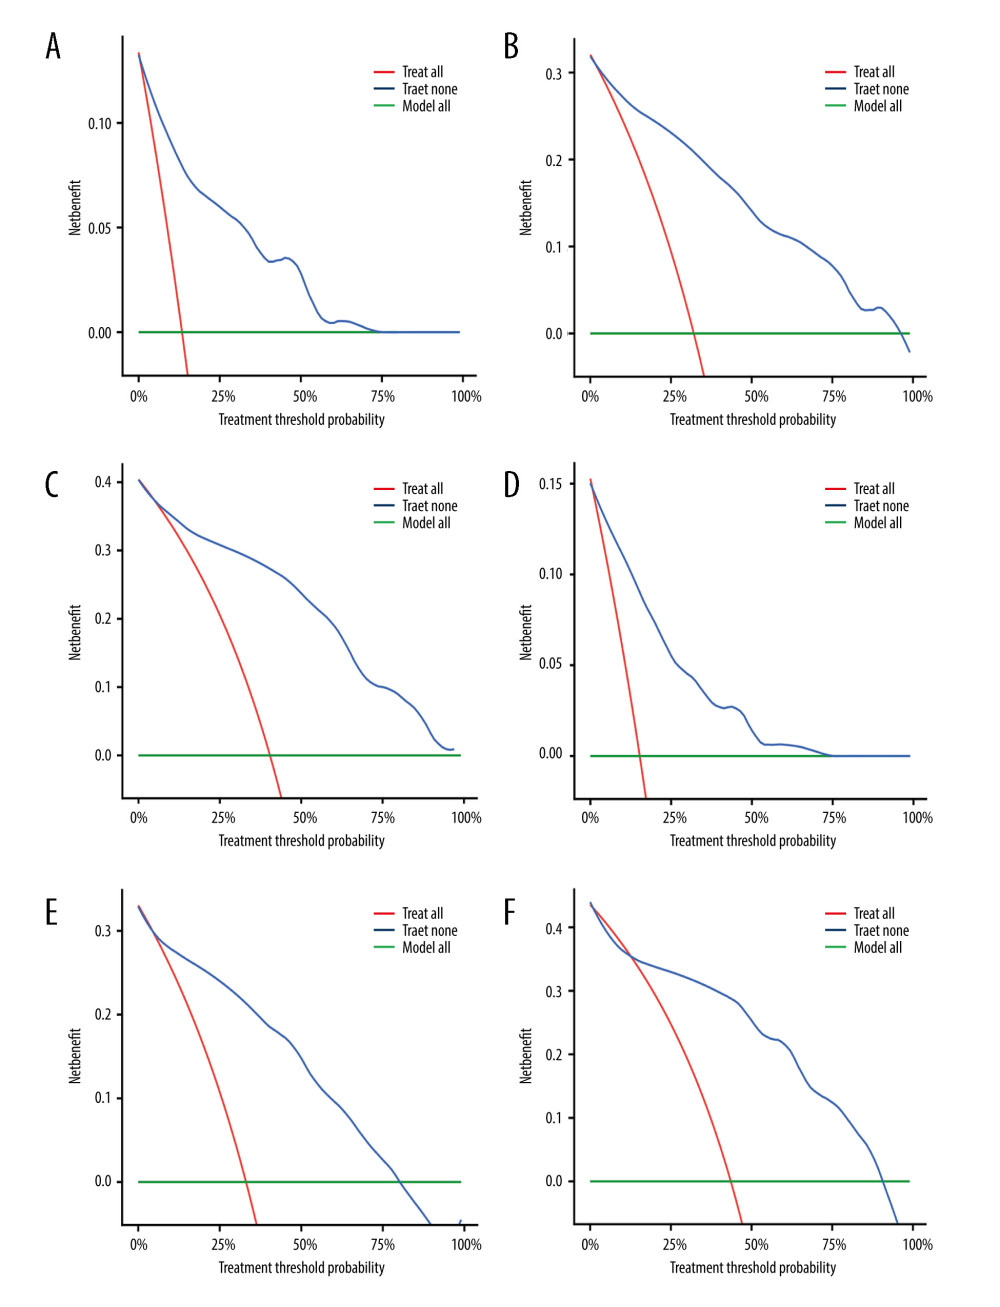 Figure 7. Decision curve analysis (DCA) for the nomogram of 1-, 3-, 5-year in the training group (A-C) and validation group (D-F) (R program, Version 4.2.3, R Foundation for Statistical Computing).
 References
1. Hariharan S, Israni AK, Danovitch G, Long-term survival after kidney transplantation: N Engl J Med, 2021; 385(8); 729-43
2. Saritas T, Kramann R, Kidney allograft fibrosis: Diagnostic and therapeutic strategies: Transplantation, 2021; 105(10); e114-e30
3. Zhang Y, Zhang J, Feng D, IRF1/ZNF350/GPX4-mediated ferroptosis of renal tubular epithelial cells promote chronic renal allograft interstitial fibrosis: Free Radic Biol Med, 2022; 193; 579-94
4. McDaniels JM, Shetty AC, Kuscu C, Single nuclei transcriptomics delineates complex immune and kidney cell interactions contributing to kidney allograft fibrosis: Kidney Int, 2023; 103(6); 1077-92
5. Halloran PF, Reeve J, Madill-Thomsen KS, The Trifecta study: Comparing plasma levels of donor-derived cell-free DNA with the molecular phenotype of kidney transplant biopsies: J Am Soc Nephrol, 2022; 33(2); 387-400
6. Langewisch E, Mannon RB, Chronic allograft injury: Clin J Ame Soc Nephrol, 2021; 16(11); 1723-29
7. Jiang K, Ferguson CM, Lerman LO, Noninvasive assessment of renal fibrosis by magnetic resonance imaging and ultrasound techniques: Transl Res, 2019; 209; 105-20
8. Ge X-Y, Lan Z-K, Lan Q-Q, Diagnostic accuracy of ultrasound-based multimodal radiomics modeling for fibrosis detection in chronic kidney disease: Eur Radiol, 2023; 33(4); 2386-98
9. Cosgrove D, Piscaglia F, Bamber J, EFSUMB guidelines and recommendations on the clinical use of ultrasound elastography. Part 2: Clinical applications: Ultraschall Med, 2013; 34(3); 238-53
10. Cui X-W, Li K-N, Yi A-J, Ultrasound elastography: Endosc Ultrasound, 2022; 11(4); 252-74
11. Cantisani V, Di Leo N, Bertolotto M, Role of multiparametric ultrasound in testicular focal lesions and diffuse pathology evaluation, with particular regard to elastography: Review of literature: Andrology, 2021; 9(5); 1356-68
12. Gonçalves LM, Forte GC, Holz TG, Shear wave elastography and Doppler ultrasound in kidney transplant recipients: Radiol Bras, 2022; 55(1); 19-23
13. Järv L, Kull I, Riispere Z, Kuudeberg A, Ultrasound elastography correlations between anthropometrical parameters in kidney transplant recipients: J Investig Med, 2019; 67(8); 1137-41
14. Yang D, Wang Y, Zhuang B, Nomogram based on high-frequency shear wave elastography (SWE) to evaluate chronic changes after kidney transplantation: Eur Radiol, 2023; 33(2); 763-73
15. Wilson MP, Katlariwala P, Low G, More studies are needed evaluating the diagnostic accuracy of magnetic resonance elastography for allograft renal transplant rejection: Korean J Radiol, 2020; 21(8); 1024-25
16. Li H, Bhatt M, Qu Z, Deep learning in ultrasound elastography imaging: A review: Med Phys, 2022; 49(9); 5993-6018
17. Hart A, Singh D, Brown SJ, Incidence, risk factors, treatment, and consequences of antibody-mediated kidney transplant rejection: A systematic review: Clin Transplant, 2021; 35(7); e14320
18. Sun H-J, Current opinion for hypertension in renal fibrosis: Adv Exp Med Biol, 2019; 1165; 37-47
19. Mori Y, Ajay AK, Chang J-H, KIM-1 mediates fatty acid uptake by renal tubular cells to promote progressive diabetic kidney disease: Cell Metab, 2021; 33(5); 1042-61.e7
20. Lim J-H, Kwon S, Jeon Y, The efficacy and safety of SGLT2 inhibitor in diabetic kidney transplant recipients: Transplantation, 2022; 106(9); e404-e12
21. Sun F, Wang H, Zhang D, One-year renal outcome in lupus nephritis patients with acute kidney injury: A nomogram model: Rheumatology, 2022; 61(7); 2886-93
22. Chen Z, Chen J, Chen H, Su Z, A nomogram based on shear wave elastography for assessment of renal fibrosis in patients with chronic kidney disease: J Nephrol, 2023; 36(3); 719-29
23. Chhajer G, Arunachalam VK, Ramasamy R, Elastography: A surrogate marker of renal allograft fibrosis–quantification by shear-wave technique: Pol J Radiol, 2021; 86(1); 151-56
24. Raynaud M, Aubert O, Divard G, Dynamic prediction of renal survival among deeply phenotyped kidney transplant recipients using artificial intelligence: An observational, international, multicohort study: Lancet Digit Health, 2021; 3(12); e795-e805
Figures
Figure 1. Comparison of ultrasound elastography and pathology findings between normal renal tissue and fibrotic renal tissue. (A) Shear wave elastography value of 18.7 kPa in normal renal tissue of the transplant kidney. (B) Shear wave elastography value of 35.1 kPa in severely fibrotic renal tissue of the transplant kidney. (C) Pathology result of normal renal tissue in the transplant kidney. (D) Pathology result of severely fibrotic renal tissue in the transplant kidney (Adobe Photoshop, 2022, Adobe, Inc.).Figure 2. Kaplan-Meier survival curve of training group, age (A), TST (B), Scr (C), GFR (D), Emean (E) (R program, Version 4.2.3, R Foundation for Statistical Computing).Figure 3. Kaplan-Meier survival curve of validation group, age (A), TST (B), Scr (C), GFR (D), Emean (E) (R program, Version 4.2.3, R Foundation for Statistical Computing).Figure 4. Prediction results of nomogram for renal fibrosis in renal fibrosis after transplantation (R program, Version 4.2.3, R Foundation for Statistical Computing).Figure 5. Area under the ROC curve (AUC) of 1-, 3-, 5-year in the training group (A) and validation group (B) (R program, Version 4.2.3, R Foundation for Statistical Computing).Figure 6. The calibration curves for the nomogram of 1-, 3-, 5-year in the training group (A-C) and validation group (D-F) (R program, Version 4.2.3, R Foundation for Statistical Computing).Figure 7. Decision curve analysis (DCA) for the nomogram of 1-, 3-, 5-year in the training group (A-C) and validation group (D-F) (R program, Version 4.2.3, R Foundation for Statistical Computing). Tables
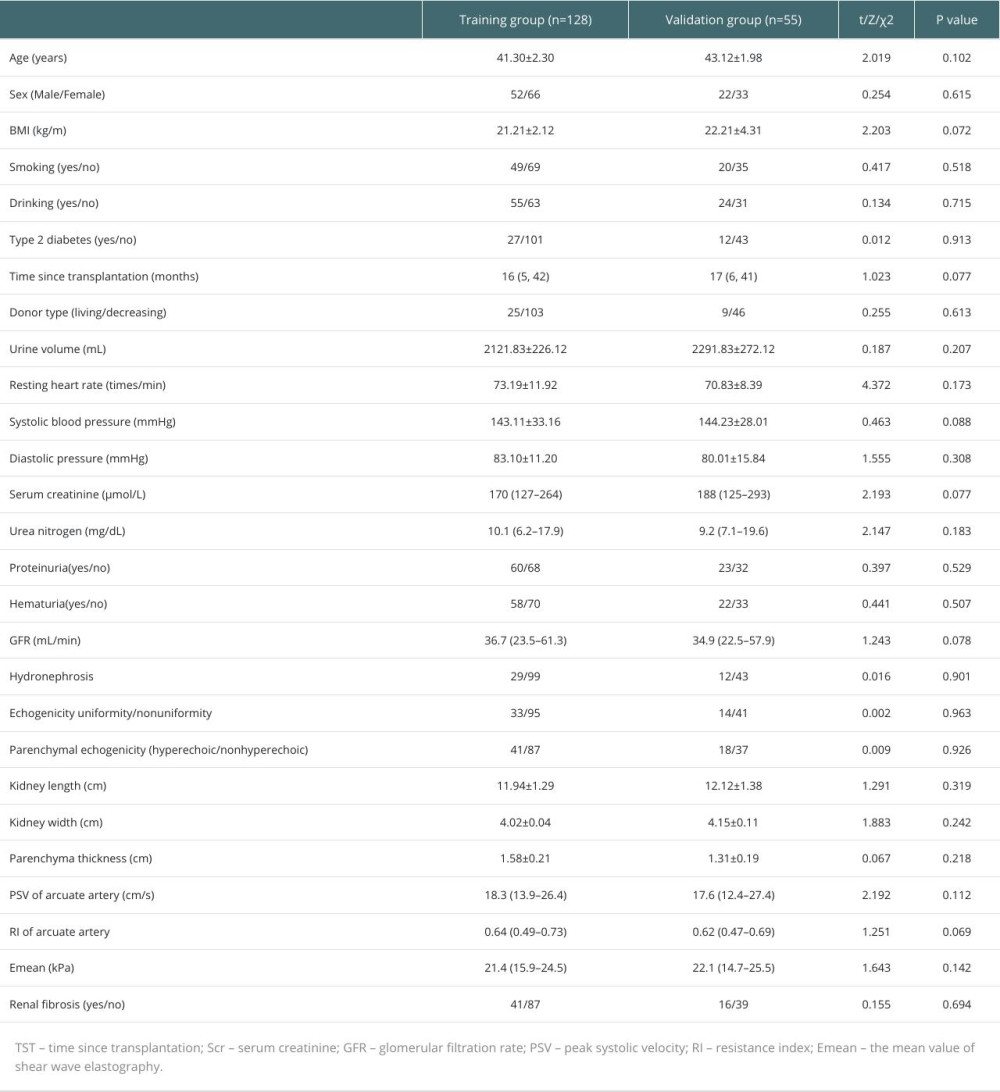 Table 1. Baseline characteristics.
 Table 2. Univariate and multivariate analysis of renal fibrosis in the training cohort.
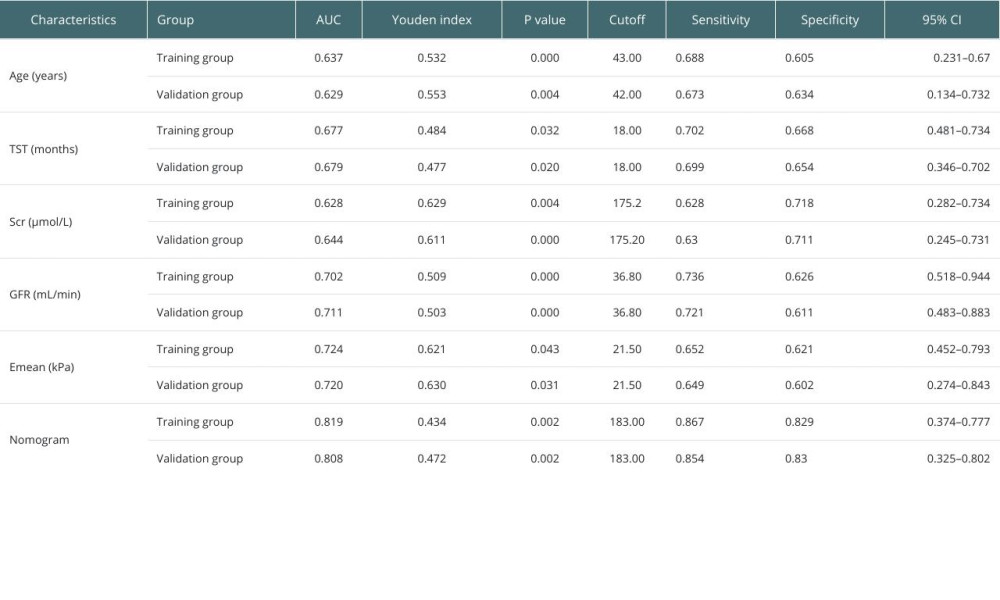 Table 3. Predictive efficacy of each independent risk factor and nomogram for predicting renal allograft fibrosis.Table 1. Baseline characteristics.Table 2. Univariate and multivariate analysis of renal fibrosis in the training cohort.Table 3. Predictive efficacy of each independent risk factor and nomogram for predicting renal allograft fibrosis.
 In Press
Original article
The Anatomical Landscape of Living Donor Livers: A 101-Case Retrospective Single-Center Study in Indonesia ...Ann Transplant In Press; DOI: 10.12659/AOT.952031
Original article
Decreased Ventilation Duration and ICU Stay Associated With Early Percutaneous Dilatational Tracheostomy Af...Ann Transplant In Press; DOI: 10.12659/AOT.953143
Original article
Immunosuppression Withdrawal in Pediatric Liver Transplant Recipients With Posttransplant Lymphoproliferati...Ann Transplant In Press; DOI: 10.12659/AOT.952021
Original article
Common Versus External Iliac Arterial Anastomosis in Kidney Transplantation: A Bicentric Retrospective Anal...Ann Transplant In Press; DOI: 10.12659/AOT.953269
Most Viewed Current Articles
24 Aug 2021 : Review article 20,864
Normothermic Machine Perfusion (NMP) of the Liver – Current Status and Future PerspectivesDOI :10.12659/AOT.931664
Ann Transplant 2021; 26:e931664
29 Dec 2021 : Original article 17,029
Efficacy and Safety of Tacrolimus-Based Maintenance Regimens in De Novo Kidney Transplant Recipients: A Sys...DOI :10.12659/AOT.933588
Ann Transplant 2021; 26:e933588
05 Apr 2022 : Original article 16,094
Impact of Statins on Hepatocellular Carcinoma Recurrence After Living-Donor Liver TransplantationDOI :10.12659/AOT.935604
Ann Transplant 2022; 27:e935604
22 Nov 2022 : Original article 16,067
Long-Term Effects of Everolimus-Facilitated Tacrolimus Reduction in Living-Donor Liver Transplant Recipient...DOI :10.12659/AOT.937988
Ann Transplant 2022; 27:e937988