28 July 2020: Original Paper
Effect of Concentration/Dose Ratio in Kidney Transplant Recipients Receiving LCP-Tacrolimus or Immediate-Release Tacrolimus: Post Hoc Analysis of a Phase 3 Clinical Trial
Barbara Suwelack1ABDE*, Suphamai Bunnapradist2BDE, Ulf Meier-Kriesche3ACDE, Daniel R. Stevens3ACDE, Claudio Procaccianti4ACDE, Roberto Morganti4ACDE, Klemens Budde5ACDEDOI: 10.12659/AOT.923278
Ann Transplant 2020; 25:e923278


Abstract
BACKGROUND: A previous phase 3 clinical trial in de novo adult kidney transplant recipients (NCT01187953) compared the efficacy and safety of once-daily LCP-tacrolimus (LCPT) and twice-daily immediate-release tacrolimus (IR-Tac). However, whether the rate of tacrolimus metabolism affects outcomes between LCPT and IR-Tac was not examined.
MATERIAL AND METHODS: Patients were initiated on 0.17 mg/kg/day LCPT or 0.1 mg/kg/day IR-Tac, with doses adjusted over time to maintain target therapeutic trough concentrations. This post hoc analysis examined dosing trends, relative efficacy, and safety of LCPT (n=247) and IR-Tac (n=249) in slow, intermediate, and rapid metabolizers as defined by concentration/dose ratios at day 30.
RESULTS: For all metabolizer subgroups, minimum target tacrolimus trough concentrations were obtained more rapidly with LCPT than with IR-Tac. Slow metabolizers were more likely to exceed target trough concentrations with LCPT, while rapid metabolizers were more likely to fall below target trough concentrations with IR-Tac. Regardless of metabolizer status, significant differences were not detected between LCPT and IR-Tac for treatment failure, death, graft failure, biopsy-proven acute rejection, estimated glomerular filtration rate, or other clinical outcomes.
CONCLUSIONS: Although within metabolizer subgroups, attainment of target trough concentrations in the first week differed between LCPT and IR-Tac, these results suggest that, regardless of metabolizer phenotype, clinical outcomes do not differ between these formulations when dose adjustments are made.
Keywords: Kidney Transplantation, Pharmacokinetics, Tacrolimus, calcineurin inhibitors, Dose-Response Relationship, Drug, Drug Administration Schedule, Graft Rejection, Immunosuppressive Agents, transplant recipients
Background
For the last 2 decades, tacrolimus has been the predominant calcineurin inhibitor used to prevent graft rejection and is prescribed in approximately 90% of adult kidney transplant recipients [1,2]. Although highly effective, tacrolimus has a narrow therapeutic window [3]. Overexposure can increase the risk of toxicities, such as new-onset diabetes, hypertension, and renal toxicity, whereas underexposure can lead to acute graft rejection [3–5].
The risk of acute nephrotoxicity increases as the trough concentration of tacrolimus rises [6], but nephrotoxicity has been reported even when the targeted maintenance trough concentrations were at the low end of the therapeutic range [7,8]. It has been proposed that nephrotoxicity might instead be related to elevated peak concentrations [9]. At the same time, low trough concentrations of tacrolimus can lead to the production of
Tacrolimus metabolism is influenced by many factors, including genetics, demographics, and comorbidities [6,14,15]. Tacrolimus is metabolized primarily by cytochrome P450 3A5 and, to a lesser extent, by CYP450 3A4, and genetic polymorphisms of these isoenzymes affect the dose of tacrolimus required to achieve therapeutic concentrations [16,17]. Individuals who carry the CYP3A5*1 allele require higher doses of tacrolimus to attain therapeutic trough concentrations, which may expose them to higher peak concentrations [18]. For example, following administration of immediate-release tacrolimus (IR-Tac), peak concentrations of tacrolimus were 33% higher in African Americans carrying the CYP3A5*1 allele than in those not carrying it.
Although polymorphisms of the CYP3A5 gene are important, they may account for less than half of the variability in the required tacrolimus dose, especially in the white population [19]. Identifying polymorphisms requires genetic testing, which is often impractical. In addition, adapting the tacrolimus dose based on CYP3A5 genotype has not been proven to improve outcomes in kidney transplantation; therefore, it has not found its way into clinical practice [20]. Because of the limitations of genetic testing and the difficulty of predicting metabolism based on patient characteristics, a convenient surrogate marker for tacrolimus metabolism is needed.
The tacrolimus blood concentration/dose (C/D) ratio is a potential surrogate marker for tacrolimus metabolism. The C/D ratio has been used to predict the rate of tacrolimus metabolism and can account for factors beyond polymorphisms [21]. In retrospective studies, renal transplant recipients identified as rapid metabolizers of tacrolimus by their C/D ratio had decreased rates of patient and overall graft survival, increased rates of rejection, more rapid decline in estimated glomerular filtration rate (eGFR), and increased rates of calcineurin inhibitor nephrotoxicity and BK nephropathy than those identified as slow metabolizers [21–23]. Similarly, a case-control study showed that renal transplant recipients with BK viremia had lower C/D ratios than controls, suggesting that faster metabolism of tacrolimus is associated with a higher risk of BK viremia [24]. However, a causal link between C/D ratio and clinical outcomes has not yet been established.
A once-daily MeltDose tablet formulation of tacrolimus, LCP-Tacrolimus (LCPT; Veloxis), is licensed in the United States (trade name Envarsus XR®) for prophylaxis of organ rejection in kidney transplant patients [25] and in Europe (trade name Envarsus®) [26] and Canada (trade name Envarsus PA®) [27] for prophylaxis of transplant rejection in adult kidney or liver allograft recipients. LCPT provides greater bioavailability than both twice-daily IR-Tac and once-daily extended-release tacrolimus capsules [28–30]. Due to greater bioavailability and a prolonged-release profile, LCPT achieves similar target trough concentrations and overall exposure at a dose approximately 30% lower than that of IR-Tac, while also producing lower peak concentrations and less peak-to-trough fluctuation [28].
The efficacy and safety of once-daily LCPT and twice-daily IR-Tac were compared in a 24-month, randomized, double-blind, phase 3 clinical trial in 543
Material and Methods
STUDY DESIGN:
This was a post hoc analysis of data from a randomized, double-blind, double-dummy, phase 3 clinical trial (NCT01187953) that compared the efficacy and safety of once-daily LCPT to twice-daily IR-Tac for the prevention of acute allograft rejection for 24 months after de novo kidney transplantation [31,32]. The study was performed at 68 sites in the USA, Latin America, Europe, and Asia between October 13, 2010 and March 26, 2014. The clinical trial was approved by the health authority, ethics committee, or institutional review board for each participating center. Informed consent was obtained from all patients, and the study was conducted in accordance with the International Conference on Harmonisation Guidelines for Good Clinical Practice and the Declaration of Helsinki. Complete methods and primary findings of this study have been published previously [31,32].
Briefly, the study included adult (≥18 years)
ENDPOINTS EXAMINED IN THIS POST HOC ANALYSIS:
Endpoints evaluated in this post hoc analysis included tacrolimus trough concentration up to month 24; total daily dose of tacrolimus up to month 24; treatment failure, death, loss to follow-up, biopsy-proven acute rejection, clinically suspected and treated acute rejection, delayed graft function, cytomegalovirus (CMV) infection, BK polyoma viremia, and BK virus nephropathy within 24 months; and eGFR at months 1 (baseline), 6, 12, 18, and 24. Treatment failure was a composite endpoint including death, graft failure, biopsy-proven acute rejection (Banff Grade ≥1A), or loss to follow-up. Data on delayed graft function, CMV infection, BK polyoma viremia, and BK virus nephropathy were collected from adverse event reports. The eGFR was estimated using the Modification of Diet in Renal Disease 7 formula [33,34].
Tacrolimus concentrations were measured in whole-blood samples drawn ≤30 min before morning doses of study medication. The central laboratory measured tacrolimus concentrations by protein precipitation, followed by solid-phase chromatography, and reverse-phase high-performance liquid chromatography-tandem mass spectroscopy. An XTerra MS C8, 2.1×100 mm, 5-μm column (Waters, Milford, MA, USA) was used, and the mobile phase was 90:10 (v/v) methanol: 0.002 M ammonium acetate in 0.1% formic acid. Rapamycin was used as the internal standard. Detection was in positive ion mode (m/z 821.500→768.450 for tacrolimus and m/z 931.570→864.480 for rapamycin). Results were quantified using the peak area ratio method. The trough concentrations were used to adjust the dose to maintain tacrolimus trough levels within the predefined therapeutic ranges. Local laboratories measured tacrolimus concentrations according to their own internal, validated liquid chromatography-mass spectroscopy methods.
The C/D ratio was determined as the tacrolimus trough concentration divided by the total daily tacrolimus dose.
STATISTICAL ANALYSIS:
This post hoc analysis included all patients in the phase 3 clinical trial who had a calculable day 30 C/D ratio based on central laboratory data, or, if unavailable, local laboratory data (full post hoc analysis set). Trough attainment on days 2–5 after treatment, clinical outcomes, and eGFR were analyzed in the full post hoc analysis set. Total daily dose was determined in patients whose C/D ratios were calculated based on central laboratory data only (central laboratory analysis set). Average trough concentration was determined in the central laboratory analysis set using central laboratory data only.
Within each treatment group, patients were split into the following metabolizer classes: rapid (C/D below 33rd percentile), intermediate (C/D 33rd to 67th percentile), and slow (C/D above 67th percentile). The relationship between the C/D ratio at day 30 and year 1 and year 2 was tested using Pearson’s correlation coefficients in the full post hoc analysis set.
For each metabolizer subgroup, the following were calculated: average tacrolimus trough concentrations obtained from local laboratory data at each study day/period, average total daily dose at each study day/period, and proportion of patients within (6–11 ng/mL), above (>11 ng/mL), or below (<6 ng/mL) the target tacrolimus trough concentration for days 2–5 after randomization. Within each metabolizer subgroup, clinical events were compared between patients receiving LCPT and IR-Tac by Fisher’s exact test. For eGFR over time, only patients with a baseline eGFR and more than 1 post-baseline observation were included. The slope of eGFR change over months 6–24 was estimated using a linear regression model for each patient. Treatment effect on the slope of eGFR changes was evaluated using analysis of covariance including treatment as a main effect and baseline eGFR (day 30 eGFR) as a covariate. Sensitivity analysis using a general linear model with mixed effects for repeated measures was also used to evaluate the treatment effect on eGFR change over time within each metabolizer subgroup. The same analysis was also performed for eGFR change from baseline. Timepoints used in the analysis are nominal visit days.
A p-value <0.05 was considered statistically significant. No adjustments were made for multiplicity. Missing data were not replaced, and no search for outliers was performed. Statistical analyses were performed using SAS version 9.4 (SAS Institute, Cary, NC, USA).
Results
PATIENTS AND METABOLIZER PHENOTYPE SUBGROUPS:
This post hoc analysis included 496 adult de novo kidney transplant recipients who had a calculable C/D ratio at day 30 based on central or local laboratory data. This included 247 patients who had been randomly allocated to LCPT and 249 who had been randomly allocated to IR-Tac (Figure 1).
Of the 496 patients included in this analysis, day 30 C/D ratios were calculated using central laboratory data for 424 (85.5%) and using local laboratory data for 72 (14.5%). Based on C/D ratios, 82 patients in both the LCPT and IR-Tac groups were categorized as rapid metabolizers (below 33rd percentile [C/D ratio <0.96 for LCPT, <0.86 for IR-Tac]), 83 patients in the LCPT group and 85 patients in the IR-Tac group as intermediate metabolizers (33rd to 67th percentile [C/D ratio 0.96–1.53 for LCPT, 0.86–1.38 for IR-Tac]), and 82 patients in both the LCPT and IR-Tac groups as slow metabolizers (above 67th percentile [C/D ratio >1.53 for LCPT, >1.38 for IR-Tac]).
Within each metabolizer subgroup, baseline demographics were similar between patients receiving LCPT and those receiving IR-Tac (Table 1). Irrespective of metabolizer subgroup or treatment received, most patients were white, male, and the mean age was between 43 and 49 years, although slow metabolizers tended to be older than rapid metabolizers. In all cases, approximately equal numbers had a living or deceased donor. Fewer than 10% of patients had a previous transplant. Treatment durations ranged from 570 to 669 days. In all metabolizer subgroups, the C/D ratio cutoffs were higher for patients receiving LCPT than for those receiving IR-Tac due to the increased bioavailability of LCPT. Results were similar in patients whose average trough concentrations and total daily doses were measured (Supplementary Table 1).
CORRELATION BETWEEN C/D RATIOS DETERMINED AT DAY 30, YEAR 1, AND YEAR 2:
For the LCPT group overall, the C/D ratio at day 30 positively correlated with the C/D ratio at year 1 (r=0.4854; p<0.0001) and year 2 (r=0.5887; p<0.0001) (Supplementary Figure 1). Similarly, for the IR-Tac group overall, the C/D ratio at day 30 positively correlated with the C/D ratio at year 1 (r=0.5784; p<0.0001) and year 2 (r=0.5857; p<0.0001) (Supplementary Figure 2).
TROUGH ATTAINMENT DURING DAYS 2–5 AFTER TREATMENT INITIATION:
For rapid metabolizers, 2 days after treatment initiation, more patients treated with IR-Tac (74.2%) than treated with LCPT (41.5%) were below the minimum target trough of 6 ng/mL (Figure 2). For over half of rapid metabolizers who received IR-Tac, trough concentrations remained below the minimum target through day 5. For intermediate and slow metabolizers, more patients treated with IR-Tac than with LCPT were below the minimum trough target; however, intermediate and slow metabolizers were more likely than rapid metabolizers to achieve minimum trough concentrations. In the overall population, tacrolimus trough concentrations on day 2 were below the minimum target of 6 ng/mL for more than twice as many patients treated with IR-Tac (61.8%) than LCPT (26.5%).
On days 2–5, for the overall population, more patients treated with LCPT (39.8–65.7%) than IR-Tac (13.5–28.6%) had trough concentrations above the target range (>11 ng/mL) (Figure 2). Also, in both treatment groups, more intermediate and slow metabolizers than rapid metabolizers had trough concentrations above the target range.
TROUGH CONCENTRATION AND DOSE OVER TIME:
Average trough concentrations and total daily dose were analyzed in patients whose day 30 C/D ratios were calculated using central laboratory data only (LCPT, n=206; IR-Tac, n=218).
For rapid metabolizers, the mean LCPT dose was relatively stable over the first 4 weeks, and mean trough concentrations were at or above the target range (6–11 ng/mL) (Figure 3). In contrast, the mean total daily dose of IR-Tac had to be increased through days 9–11 to achieve a trough concentration within the target range. For intermediate and slow metabolizers, use of LCPT resulted in mean trough concentrations that exceeded the target range for several weeks following initiation (days 18–25 for intermediate metabolizers (Figure 4) and days 26–37 for slow metabolizers (Figure 5)). For these 2 metabolizer subgroups, the mean total daily dose of LCPT had to be reduced over time to attain recommended trough concentrations. For IR-Tac, the mean total daily dose in the intermediate and slow metabolizer subgroups remained relatively consistent in the 9–11 days after randomization because mean trough concentrations were within the therapeutic target range.
OUTCOMES:
Within each metabolizer subgroup, differences between treatments were not statistically significant for treatment failure, death, graft failure, loss to follow-up, biopsy-proven acute rejection, clinical suspected and treated acute rejection, delayed graft function, CMV infection, BK polyoma viremia, or BK nephropathy (Figure 6). For the overall population, the incidence of each event was similar between treatment groups.
RENAL FUNCTION:
For the overall population, and within each individual metabolizer subgroup, the slope of the observed eGFR change over months 6–24 did not significantly differ between treatments (Table 2, Supplementary Figure 3). Sensitivity analyses did not find treatment differences within any metabolizer subgroup for observed eGFR or change in eGFR from baseline (Supplementary Table 2).
DOSES OF CONCOMITANT MEDICATIONS:
Doses of concomitant corticosteroids and mycophenolate were similar for the 2 treatment groups over time (Supplementary Figures 4 and 5, respectively).
Discussion
In a phase 3 clinical trial, the efficacy and safety of once-daily LCPT and twice-daily IR-Tac were previously compared in 543
Trough concentrations were initially higher in the intermediate and slow metabolizer subgroups with the starting dose of LCPT, but dosing adjustments corrected elevated trough concentrations. In contrast, in over half of rapid metabolizers initiating treatment with IR-Tac, trough concentrations were below the minimum target through day 5, which required doses of IR-Tac to be increased. These data emphasize that therapeutic drug monitoring can be used to drive dose adjustments and thereby reduce over- or under-exposure.
Although therapeutic drug monitoring and subsequent dose adjustments allowed target tacrolimus concentrations to be attained, delays in achieving minimum target concentrations might lead to graft rejection [4,10]. However, this study did not identify statistically significant differences in rejection rates between formulations in any metabolizer group. However, the study was not designed or powered to detect differences within these subgroups. Nonetheless, we observed a favorable trend with LCPT. Fewer rapid metabolizers experienced a rejection with LCPT (23.2%) than with IR-Tac (36.6%). Multiple factors influence the risk of rejection, such as potency of the induction agent and number of concomitant immunosuppressive maintenance therapies prescribed; therefore, clinicians may place varying levels of importance on early achievement of minimum therapeutic concentrations.
Because this analysis was based on a clinical trial, most of the endpoints were collected prospectively, allowing more complete collection than in retrospective studies. An exception was viral infections, including BK and CMV, which were collected through adverse event reporting. The present analysis also benefitted from a relatively large population, although for some events, low frequencies limited the ability to make inferences. The duration of this study also permitted outcomes to be assessed for up to 24 months, which has been sufficient to detect differences in eGFR between metabolizer groups in other studies [9,21].
Pharmacogenetic testing could have provided information on individual polymorphisms known to affect tacrolimus metabolism and helped to identify metabolizer status, but it was not assessed in the clinical trial. Furthermore, not all variants affecting tacrolimus metabolism have been identified [19,35]. We instead used the C/D ratio, which is more practical than pharmacogenetic testing for identifying rapid metabolizers. Several studies have demonstrated the utility of the C/D ratio for classifying patients and exploring the relationship between the C/D ratio and outcomes [9,21,22,35,36], and a recent meta-analysis provided strong evidence that kidney transplant recipients can be grouped into metabolizer subgroups using the C/D ratio [37]. For this analysis, we used the C/D ratio at day 30 to determine metabolizer phenotype. C/D ratio at day 30 appeared to be a valid assessment as demonstrated by the marked differences in tacrolimus trough concentrations and doses between subgroups. Indeed, due to the greater bioavailability of LCPT, breakpoints for C/D ratios between metabolizer subgroups were generally higher for LCPT than for IR-Tac, leading to lower total daily dose being used to achieve comparable trough levels. Other studies have used an average C/D ratio determined 1, 3, and 6 months after renal transplantation [21,24]. However, in this study, 30 days was sufficient to reach a steady state and achieve therapeutic concentrations with a stable dose of IR-Tac or LCPT, and the C/D ratio at day 30 was correlated with the ratios at year 1 and 2, suggesting that the day 30 C/D ratio was generally adequate for determining metabolizer status.
Although trough concentrations were measured as a correlate for overall exposure, peak concentrations were not measured in this study. Elevated peak concentrations may be associated with calcineurin inhibitor-related toxicities [19]. A study of 38 kidney transplant recipients who experienced tacrolimus-induced hand tremor while on twice-daily IR-Tac showed that switching to LCPT reduced hand tremors but maintained comparable tacrolimus trough concentrations, suggesting that the difference was due to lower peak concentrations [38]. Another study of patients receiving IR-Tac after transplant found lower mean trough concentrations but also lower eGFR in rapid metabolizers than in slow metabolizers, suggesting that the resulting nephrotoxicity was due to higher peak tacrolimus concentrations [9]. Peak concentrations of tacrolimus have been reported in genotype-confirmed patient populations [18], but little data on peak concentrations within individual metabolizer groups are available. To better understand differences in tacrolimus formulations, further studies should investigate differences in both peak and trough concentrations for different metabolizer phenotypes.
This post hoc analysis did not examine differences between metabolizer groups but rather focused on the relative safety and efficacy of LCPT and IR-Tac within individual metabolizer subgroups and, moreover, was not powered to detect differences between subgroups. How metabolizer status affects clinical outcomes for patients receiving tacrolimus has been examined in other studies [9,21,22,35]. In a recent retrospective analysis, renal transplant recipients who received IR-Tac and were categorized as fast metabolizers according to their C/D ratio had lower patient survival, lower overall graft survival, a more rapid decline in eGFR, and a higher rejection rate over 5 years than slow metabolizers [22]. In renal and liver transplant recipients who received IR-Tac, rapid metabolizers, as determined by C/D ratio, had worse renal function than slow metabolizers [9,21]. Furthermore, a case-control study of patients treated with either immediate-release or extended-release tacrolimus showed that renal transplant patients with BK viremia had a significantly lower C/D ratio than the control group, indicating more rapid tacrolimus metabolism [24].
Conclusions
The previous analysis of data from this trial indicated that even though attainment of target tacrolimus trough concentrations in the first week post-transplant differed between LCPT and IR-Tac, clinical outcomes do not differ between these formulations as long as dose adjustments are made [31,32]. Because metabolizer status can affect the susceptibility to BK virus infections, rejection, and calcineurin inhibitor-related nephrotoxicity [21–24], it is important to examine the interaction between metabolizer status, tacrolimus formulations, and clinical outcomes. The present study provides evidence that, irrespective of metabolizer status, when dose adjustments are made, outcomes do not differ between LCPT and IR-Tac. It also reveals how dosing and trough level attainment changes with C/D ratio, a surrogate marker of metabolizer status. Further appropriately powered studies are needed to confirm these findings and clarify the relationship between outcomes and tacrolimus peak and trough concentrations.
Figures
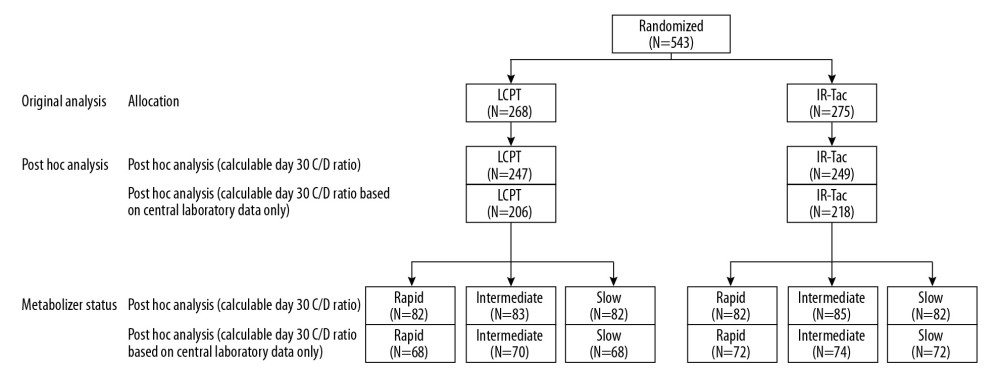 Figure 1. Patient disposition. This post hoc analysis included patients who had a calculable day 30 C/D ratio based on central or local laboratory data. Trough attainment on days 2–5 after treatment, clinical outcomes, and eGFR were analyzed in all patients included in the post hoc analysis. Average trough concentration and total daily dose were determined in patients whose C/D ratios were calculated from central laboratory data only. C/D – concentration/dose; IR-Tac – immediate-release tacrolimus; LCPT – LCP-tacrolimus.
 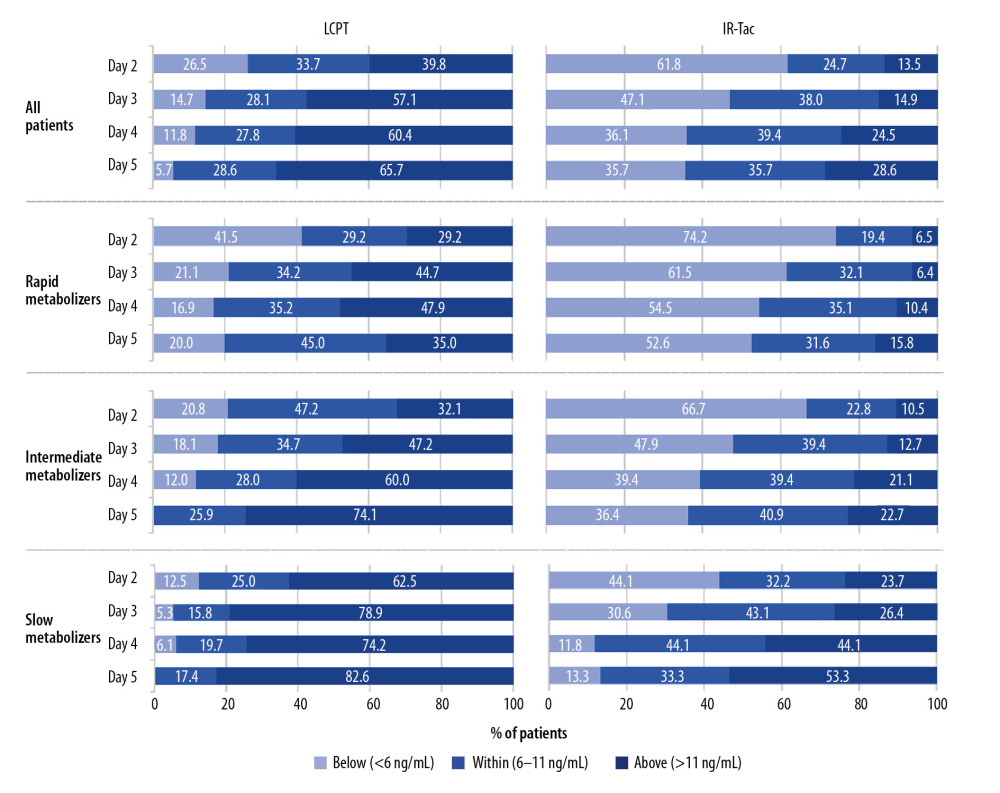 Figure 2. Attainment of trough concentrations on days 2–5. The analysis population consisted of patients who had a calculable day 30 C/D ratio based on central or local laboratory data. Shown are the proportions of patients above, within, or below the target range. C/D – concentration/dose; IR-Tac – immediate-release tacrolimus; LCPT – LCP-tacrolimus.
 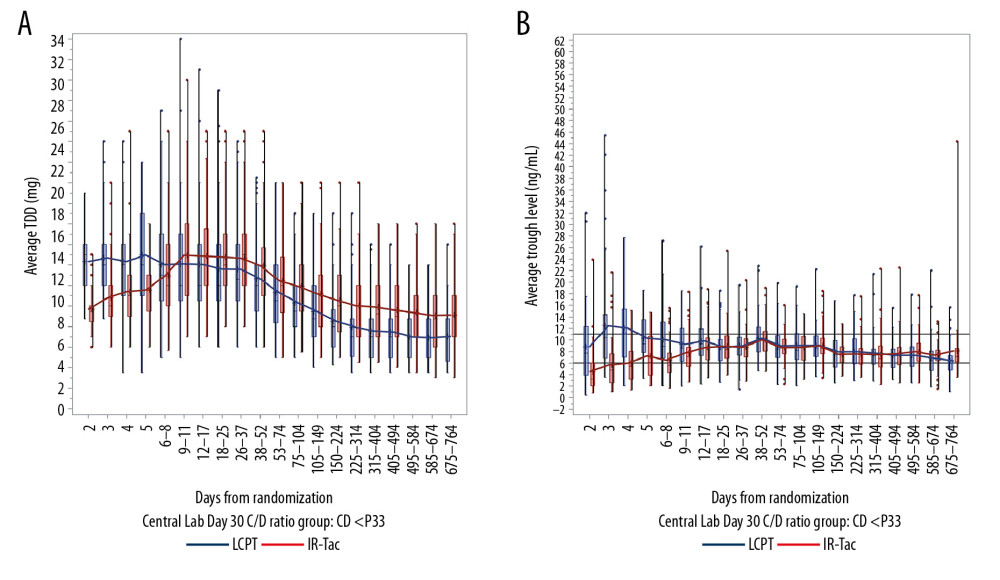 Figure 3. Total daily dose (A) and trough concentrations (B) of tacrolimus in rapid metabolizers. The analysis population consisted of patients who had a calculable day 30 C/D ratio based on central laboratory data only. Central boxes indicate the 25th to 75th percentile, and central lines the median (50th percentile). Whiskers indicate full concentration ranges. Lines connect the mean trough concentrations. C/D – concentration/dose; IR-Tac – immediate-release tacrolimus; LCPT – LCP-tacrolimus.
 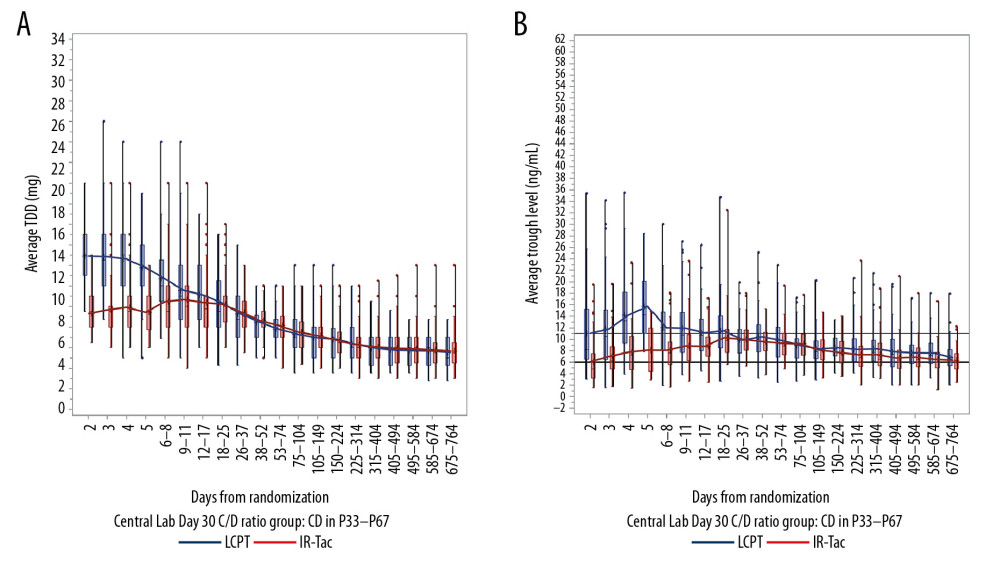 Figure 4. Total daily dose (A) and trough concentrations (B) of tacrolimus in intermediate metabolizers. The analysis population consisted of patients who had a calculable day 30 C/D ratio based on central laboratory data only. Central boxes indicate the 25th to 75th percentile, and central lines the median (50th percentile). Whiskers indicate full concentration ranges. Lines connect the mean trough concentrations. C/D – concentration/dose; IR-Tac – immediate-release tacrolimus; LCPT – LCP-tacrolimus.
 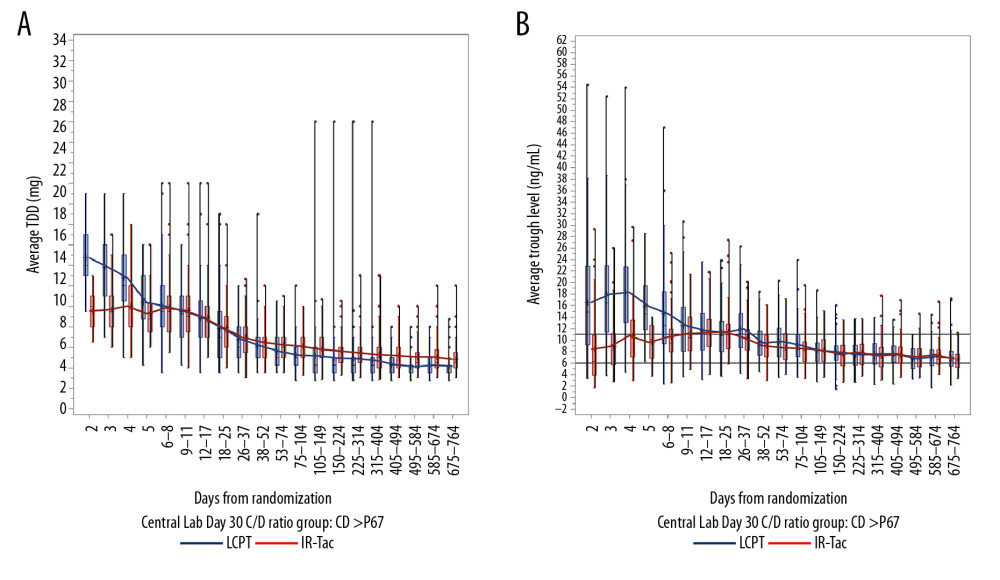 Figure 5. Total daily dose (A) and trough concentrations (B) of tacrolimus in slow metabolizers. The analysis population consisted of patients who had a calculable day 30 C/D ratio based on central laboratory data only. Central boxes indicate the 25th to 75th percentile, and central lines the median (50th percentile). Whiskers indicate full concentration ranges. Lines connect the mean trough concentrations. C/D – concentration/dose; IR-Tac – immediate-release tacrolimus; LCPT – LCP-tacrolimus.
 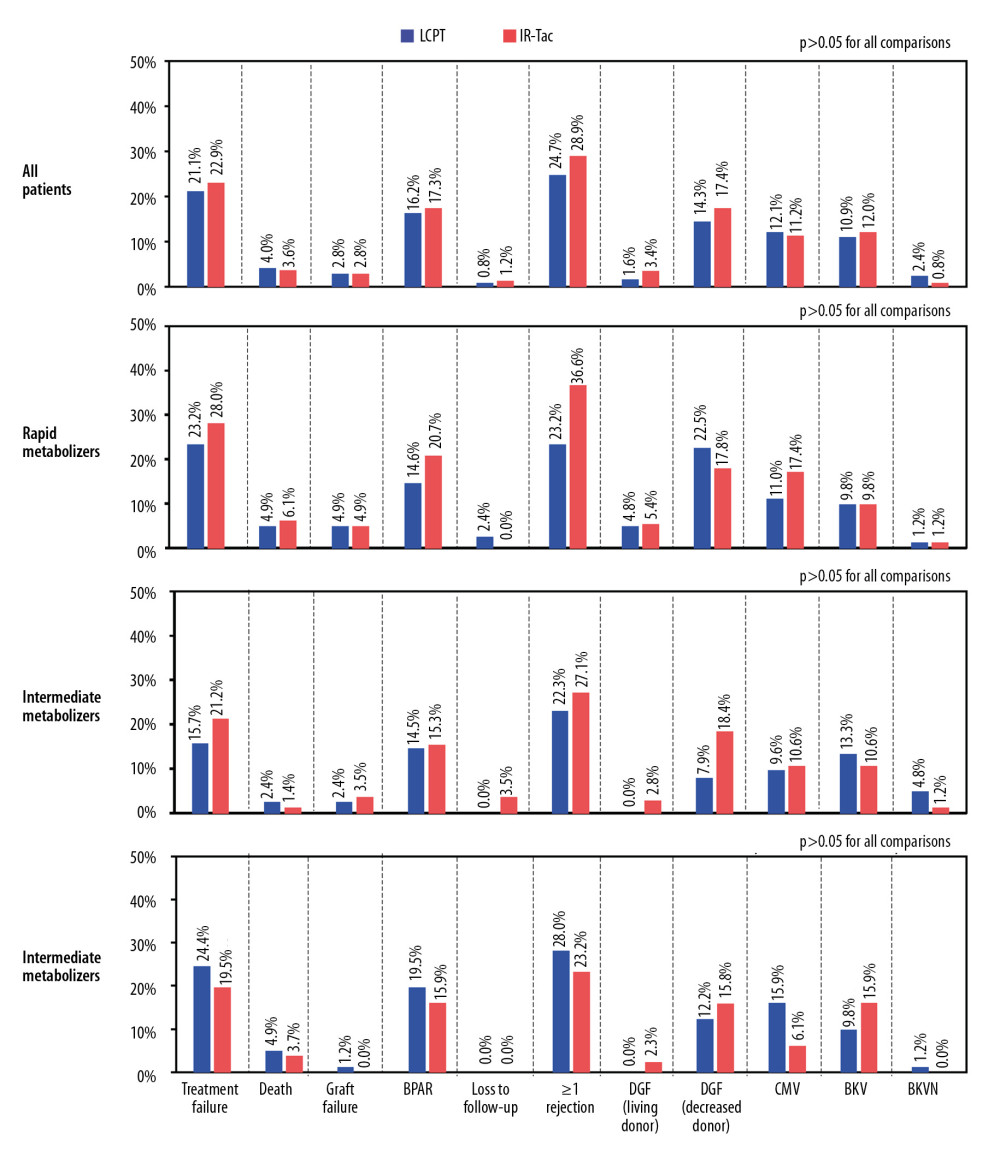 Figure 6. Clinical outcomes overall and by metabolizer phenotype. The analysis population consisted of patients who had a calculable day 30 C/D ratio based on central or local laboratory data. For all patients and within metabolizer subgroups, there were no statistically significant differences between treatments for any event. BKV, BK viremia; BKVN – BK virus nephropathy; BPAR – biopsy-proven acute rejection; CMV – cytomegalovirus; DGF – delayed graft function.
 Tables
Table 1. Baseline characteristics.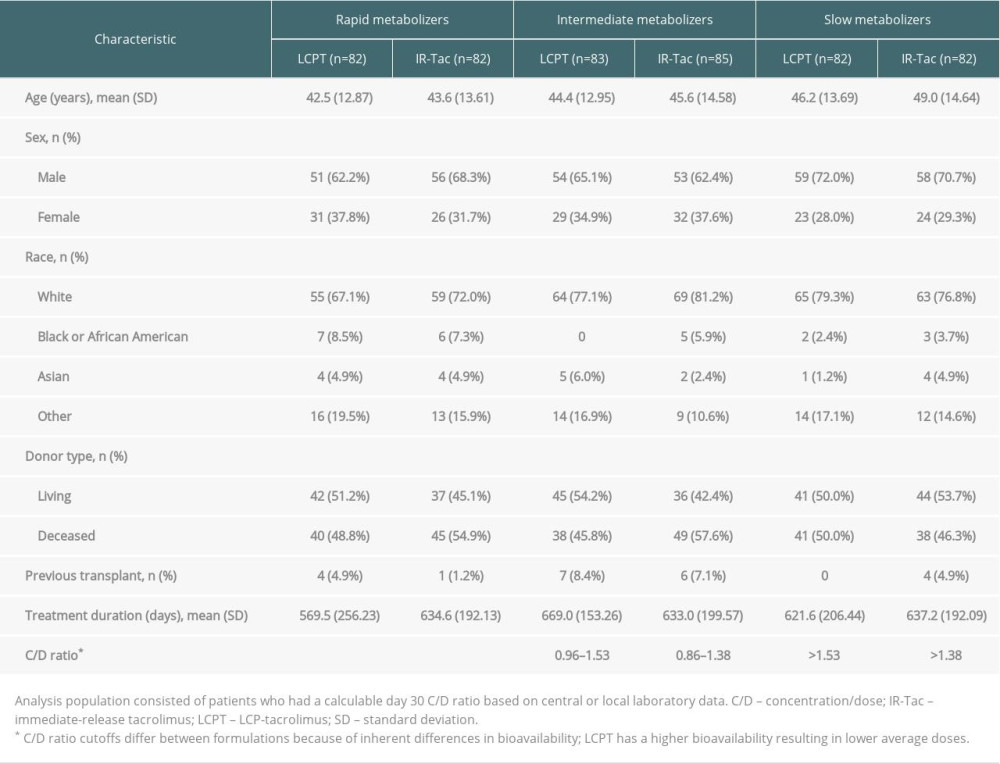 Table 2. Slope of eGFR change over months 6–24.
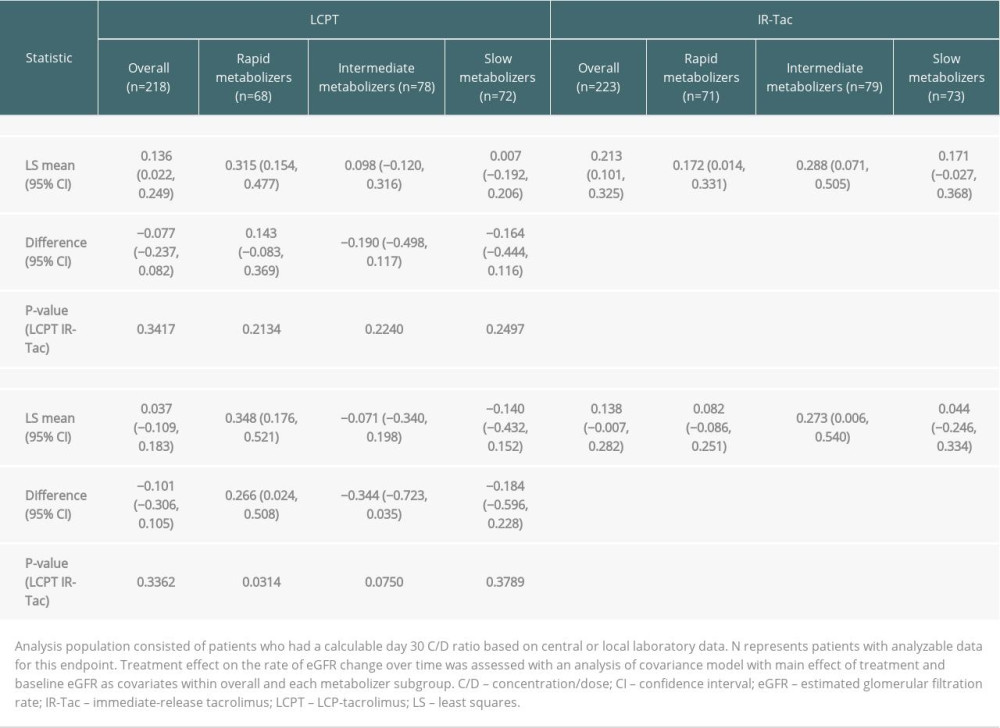 Supplementary Table 1. Baseline characteristics of the analysis population used to evaluate tacrolimus trough concentrations and total daily dose.
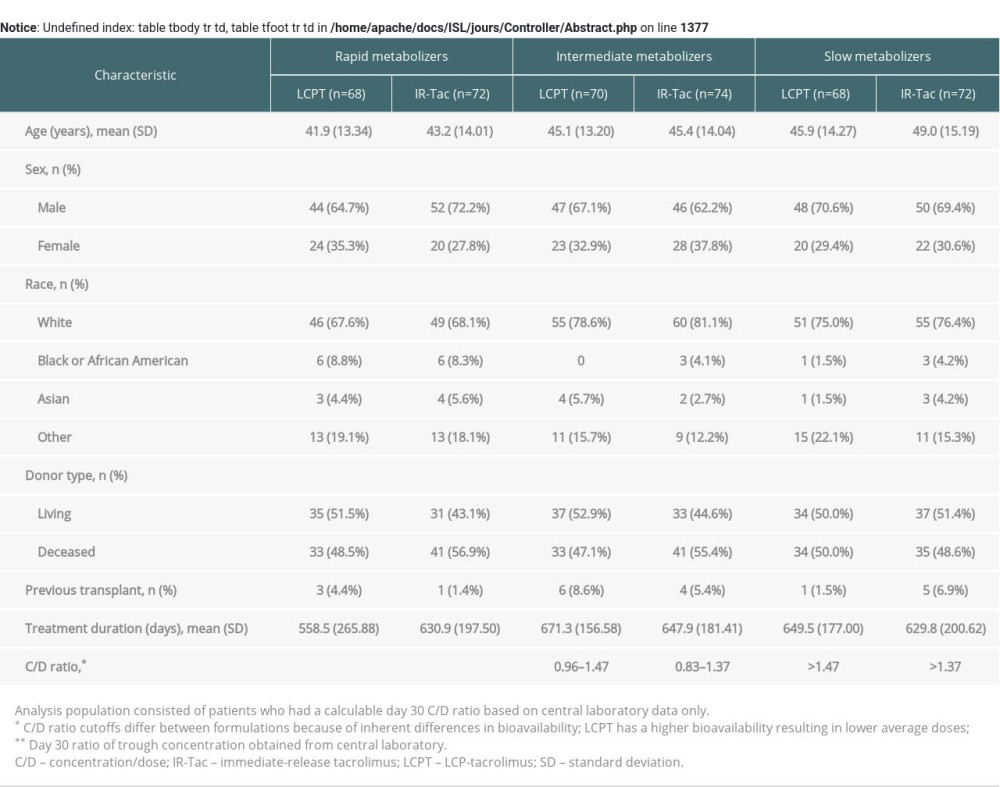 Supplementary Table 2. Sensitivity analyses for eGFR (mL/min/1.73 m2) at months 1–24.
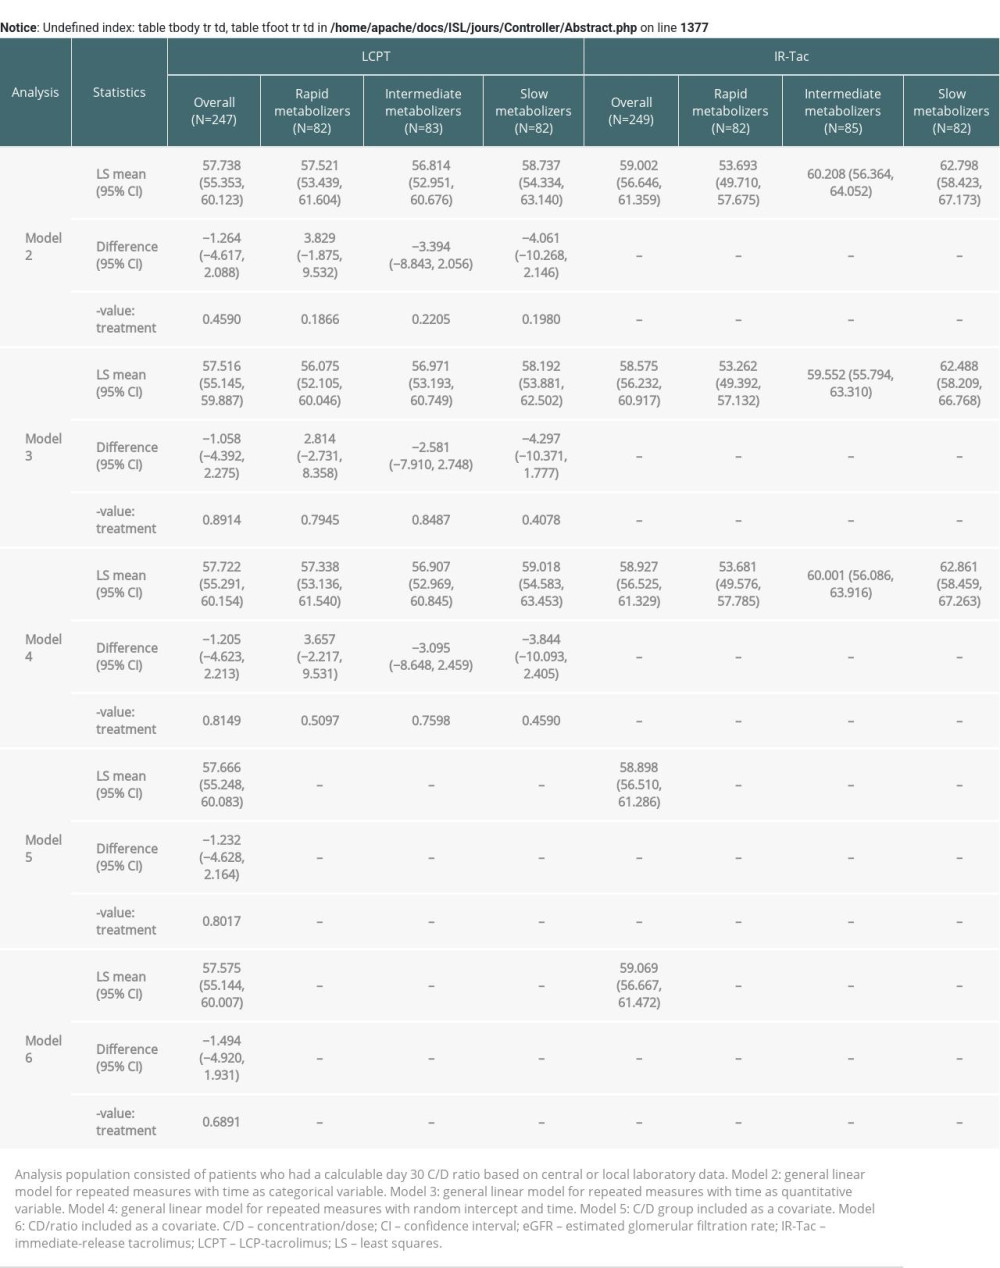
References
1. Hart A, Smith JM, Skeans MA, Optn/srtr 2016 annual data report: Kidney: Am J Transplant, 2018; 18(Suppl 1); 18-113
2. Meier-Kriesche HU, Li S, Gruessner RW, Immunosuppression: Evolution in practice and trends, 1994–2004: Am J Transplant, 2006; 6; 1111-31
3. : Draft guidance on tacrolimus, 2019 https://www.accessdata.fda.gov/drugsatfda_docs/psg/PSG%20for%20Tacrolimus%20Ointment%200.03%202018-09-13.pdf
4. Kidney Disease: Improving Global Outcomes Transplant Work Group, Kdigo clinical practice guideline for the care of kidney transplant recipients: Am J Transplant, 2009; 9(Suppl 3); S1-155
5. Malvezzi P, Rostaing L, The safety of calcineurin inhibitors for kidney-transplant patients: Expert Opin Drug Saf, 2015; 14; 1531-46
6. Jacobson PA, Schladt D, Israni A, Genetic and clinical determinants of early, acute calcineurin inhibitor-related nephrotoxicity: Results from a kidney transplant consortium: Transplantation, 2012; 93; 624-31
7. Ekberg H, van Gelder T, Kaplan B, Bernasconi C, Relationship of tacrolimus exposure and mycophenolate mofetil dose with renal function after renal transplantation: Transplantation, 2011; 92; 82-87
8. Tsuchiya T, Ishida H, Tanabe T, Comparison of pharmacokinetics and pathology for low-dose tacrolimus once-daily and twice-daily in living kidney transplantation: Prospective trial in once-daily versus twice-daily tacrolimus: Transplantation, 2013; 96; 198-204
9. Tholking G, Siats L, Fortmann C, Tacrolimus concentration/dose ratio is associated with renal function after liver transplantation: Ann Transplant, 2016; 21; 167-79
10. Davis S, Gralla J, Klem P: Am J Transplant, 2018; 18; 907-15
11. Gatault P, Kamar N, Buchler M, Reduction of extended-release tacrolimus dose in low-immunological-risk kidney transplant recipients increases risk of rejection and appearance of donor-specific antibodies: A randomized study: Am J Transplant, 2017; 17; 1370-79
12. Staatz CE, Tett SE, Clinical pharmacokinetics and pharmacodynamics of tacrolimus in solid organ transplantation: Clin Pharmacokinet, 2004; 43; 623-53
13. Venkataramanan R, Swaminathan A, Prasad T, Clinical pharmacokinetics of tacrolimus: Clin Pharmacokinet, 1995; 29; 404-30
14. Mancinelli LM, Frassetto L, Floren LC, The pharmacokinetics and metabolic disposition of tacrolimus: A comparison across ethnic groups: Clin Pharmacol Ther, 2001; 69; 24-31
15. Stratta P, Quaglia M, Cena T, The interactions of age, sex, body mass index, genetics, and steroid weight-based doses on tacrolimus dosing requirement after adult kidney transplantation: Eur J Clin Pharmacol, 2012; 68; 671-80
16. Dai Y, Hebert MF, Isoherranen N: Drug Metab Dispos, 2006; 34; 836-47
17. Tavira B, Coto E, Diaz-Corte C, Pharmacogenetics of tacrolimus after renal transplantation: Analysis of polymorphisms in genes encoding 16 drug metabolizing enzymes: Clin Chem Lab Med, 2011; 49; 825-33
18. Trofe-Clark J, Brennan DC, West-Thielke P, Results of asertaa, a randomized prospective crossover pharmacogenetic study of immediate-release versus extended-release tacrolimus in african american kidney transplant recipients: Am J Kidney Dis, 2018; 71; 315-26
19. Andrews LM, De Winter BC, Van Gelder T, Hesselink DA, Consideration of the ethnic prevalence of genotypes in the clinical use of tacrolimus: Pharmacogenomics, 2016; 17; 1737-40
20. Pallet N, Etienne I, Buchler M, Long-term clinical impact of adaptation of initial tacrolimus dosing to cyp3a5 genotype: Am J Transplant, 2016; 16; 2670-75
21. Tholking G, Fortmann C, Koch R, The tacrolimus metabolism rate influences renal function after kidney transplantation: PLoS One, 2014; 9; e111128
22. Schütte-Nütgen K, Tholking G, Steinke J, Fast tac metabolizers at risk (–) it is time for a C/D ratio calculation: J Clin Med, 2019; 8; 587
23. Thölking G, Schütte-Nütgen K, Schmitz J, A low tacrolimus concentration/dose ratio increases the risk for the development of acute calcineurin inhibitor-induced nephrotoxicity: J Clin Med, 2019; 8; 1586
24. Tholking G, Schmidt C, Koch R, Influence of tacrolimus metabolism rate on bkv infection after kidney transplantation: Sci Rep, 2016; 6; 32273
25. : Envarsus xr [package insert], 2018, Cary NC, Veloxis Pharmaceuticals
26. : Envarsus [summary of product characteristics], 2016, Manchester UK, Chiesi Limited https://www.ema.europa.eu/en/documents/product-information/envarsus-epar-product-information_en.pdf
27. : Prenvarsus patm [product monograph], 2019, Dublin Ireland, Endo Ventures, Ltd https://www.paladin-labs.com/our_products/EnvarsusPA__EN.pdf
28. Gaber AO, Alloway RR, Bodziak K, Conversion from twice-daily tacrolimus capsules to once-daily extended-release tacrolimus (lcpt): A phase 2 trial of stable renal transplant recipients: Transplantation, 2013; 96; 191-97
29. Kamar N, Cassuto E, Piotti G: Adv Ther, 2019; 36; 462-77
30. Tremblay S, Nigro V, Weinberg J, A steady-state head-to-head pharmacokinetic comparison of all fk-506 (tacrolimus) formulations (astcoff): An open-label, prospective, randomized, two-arm, three-period crossover study: Am J Transplant, 2017; 17; 432-42
31. Budde K, Bunnapradist S, Grinyo JM: Am J Transplant, 2014; 14; 2796-806
32. Rostaing L, Bunnapradist S, Grinyo JM: Am J Kidney Dis, 2016; 67; 648-59
33. Cockcroft DW, Gault MH, Prediction of creatinine clearance from serum creatinine: Nephron, 1976; 16; 31-41
34. Nankivell BJ, Gruenewald SM, Allen RD, Chapman JR, Predicting glomerular filtration rate after kidney transplantation: Transplantation, 1995; 59; 1683-89
35. Jouve T, Fonrose X, Noble J, The tomato study (tacrolimus metabolization in kidney transplantation): Impact of the concentration-dose ratio on death-censored graft survival: Transplantation, 2019; 104; 1263-71
36. Kwiatkowska E, Kwiatkowski S, Wahler F, C/D ratio in long-term renal function: Transplant Proc, 2019; 51; 3265-70
37. Khan AR, Raza A, Firasat S, Abid A, Cyp3a5 gene polymorphisms and their impact on dosage and trough concentration of tacrolimus among kidney transplant patients: A systematic review and meta-analysis: Pharmacogenomics J, 2020 [Online ahead of print]
38. Langone A, Steinberg SM, Gedaly R, Switching study of kidney transplant patients with tremor to lcp-tacro (strato): An open-label, multicenter, prospective phase 3b study: Clin Transplant, 2015; 29; 796-805
Figures
Figure 1. Patient disposition. This post hoc analysis included patients who had a calculable day 30 C/D ratio based on central or local laboratory data. Trough attainment on days 2–5 after treatment, clinical outcomes, and eGFR were analyzed in all patients included in the post hoc analysis. Average trough concentration and total daily dose were determined in patients whose C/D ratios were calculated from central laboratory data only. C/D – concentration/dose; IR-Tac – immediate-release tacrolimus; LCPT – LCP-tacrolimus.Figure 2. Attainment of trough concentrations on days 2–5. The analysis population consisted of patients who had a calculable day 30 C/D ratio based on central or local laboratory data. Shown are the proportions of patients above, within, or below the target range. C/D – concentration/dose; IR-Tac – immediate-release tacrolimus; LCPT – LCP-tacrolimus.Figure 3. Total daily dose (A) and trough concentrations (B) of tacrolimus in rapid metabolizers. The analysis population consisted of patients who had a calculable day 30 C/D ratio based on central laboratory data only. Central boxes indicate the 25th to 75th percentile, and central lines the median (50th percentile). Whiskers indicate full concentration ranges. Lines connect the mean trough concentrations. C/D – concentration/dose; IR-Tac – immediate-release tacrolimus; LCPT – LCP-tacrolimus.Figure 4. Total daily dose (A) and trough concentrations (B) of tacrolimus in intermediate metabolizers. The analysis population consisted of patients who had a calculable day 30 C/D ratio based on central laboratory data only. Central boxes indicate the 25th to 75th percentile, and central lines the median (50th percentile). Whiskers indicate full concentration ranges. Lines connect the mean trough concentrations. C/D – concentration/dose; IR-Tac – immediate-release tacrolimus; LCPT – LCP-tacrolimus.Figure 5. Total daily dose (A) and trough concentrations (B) of tacrolimus in slow metabolizers. The analysis population consisted of patients who had a calculable day 30 C/D ratio based on central laboratory data only. Central boxes indicate the 25th to 75th percentile, and central lines the median (50th percentile). Whiskers indicate full concentration ranges. Lines connect the mean trough concentrations. C/D – concentration/dose; IR-Tac – immediate-release tacrolimus; LCPT – LCP-tacrolimus.Figure 6. Clinical outcomes overall and by metabolizer phenotype. The analysis population consisted of patients who had a calculable day 30 C/D ratio based on central or local laboratory data. For all patients and within metabolizer subgroups, there were no statistically significant differences between treatments for any event. BKV, BK viremia; BKVN – BK virus nephropathy; BPAR – biopsy-proven acute rejection; CMV – cytomegalovirus; DGF – delayed graft function. Tables
Table 1. Baseline characteristics.Table 2. Slope of eGFR change over months 6–24.Table 1. Baseline characteristics.Table 2. Slope of eGFR change over months 6–24.Supplementary Table 1. Baseline characteristics of the analysis population used to evaluate tacrolimus trough concentrations and total daily dose.Supplementary Table 2. Sensitivity analyses for eGFR (mL/min/1.73 m2) at months 1–24. In Press
Original article
The Anatomical Landscape of Living Donor Livers: A 101-Case Retrospective Single-Center Study in Indonesia ...Ann Transplant In Press; DOI: 10.12659/AOT.952031
Original article
Decreased Ventilation Duration and ICU Stay Associated With Early Percutaneous Dilatational Tracheostomy Af...Ann Transplant In Press; DOI: 10.12659/AOT.953143
Original article
Immunosuppression Withdrawal in Pediatric Liver Transplant Recipients With Posttransplant Lymphoproliferati...Ann Transplant In Press; DOI: 10.12659/AOT.952021
Original article
Common Versus External Iliac Arterial Anastomosis in Kidney Transplantation: A Bicentric Retrospective Anal...Ann Transplant In Press; DOI: 10.12659/AOT.953269
Most Viewed Current Articles
24 Aug 2021 : Review article 20,864
Normothermic Machine Perfusion (NMP) of the Liver – Current Status and Future PerspectivesDOI :10.12659/AOT.931664
Ann Transplant 2021; 26:e931664
29 Dec 2021 : Original article 17,029
Efficacy and Safety of Tacrolimus-Based Maintenance Regimens in De Novo Kidney Transplant Recipients: A Sys...DOI :10.12659/AOT.933588
Ann Transplant 2021; 26:e933588
05 Apr 2022 : Original article 16,094
Impact of Statins on Hepatocellular Carcinoma Recurrence After Living-Donor Liver TransplantationDOI :10.12659/AOT.935604
Ann Transplant 2022; 27:e935604
22 Nov 2022 : Original article 16,067
Long-Term Effects of Everolimus-Facilitated Tacrolimus Reduction in Living-Donor Liver Transplant Recipient...DOI :10.12659/AOT.937988
Ann Transplant 2022; 27:e937988