04 July 2023: Original Paper
Drug Overdose and Cardiovascular Deaths Among Deceased Organ Donors: Implications for Donor Utilization and Data Reporting
Michie A. AdjeiDOI: 10.12659/AOT.940255
Ann Transplant 2023; 28:e940255
Abstract
BACKGROUND: The present study evaluated expanded cause of death (COD) definitions and its implications on donor utilization for solid organ transplantation.
MATERIAL AND METHODS: The OPTN Standard Transplant and Research file was queried for potential donors between 2005 and 2019. Donor- and organ-specific utilization were evaluated. Expanded donor COD were identified: trauma, cardiovascular (CV), cerebrovascular accident (CVA) or stroke, drug intoxication (DI), anoxia not otherwise specified (NOS), and other. Descriptive analyses and multivariable logistic regression analyses for donor utilization were performed.
RESULTS: Among 132 783 potential donors identified, the most common COD was CVA/Stroke (n=44 707, 33.7%), followed by trauma (n=43 356, 32.7%), CV (n=20 053, 15.1%), anoxia-NOS (n=12 261, 9.2%), DI (n=10 205, 7.7%), and other causes (n=2201, 1.7%). Significant differences between CV, DI, and anoxia-NOS groups existed for donor age, sex, ethnicity, body mass index, and comorbidities. Donors from trauma had the highest unadjusted utilization rate (97.2%) while CV donors had the lowest (90.1%). Multivariable analysis of brain-dead donors (DBD) showed that compared to trauma, donors from DI had higher likelihood of utilization (odds ratio 1.217, 95% 1.025-1.446) while CV donors were lower (OR 0.717, 95% CI 0.642-0.800, P<0.001). Among donation after circulatory death (DCD) donors, there was decreased utilization compared to trauma for both CV (OR 0.607, 95% CI 0.523-0.705) and DI (OR 0.754, 95% CI 0.603-0.914, P<0.001).
CONCLUSIONS: Current COD definitions should be expanded to capture significant differences in the donor population. DI donors are the fastest growing cohort and the most likely utilized DBD donors, while trauma donors remain the most likely utilized DCD donors.
Keywords: Donor Selection, Drug Overdose, Organ Transplantation, Humans, Tissue and Organ Procurement, Research Design, Tissue Donors, Brain Death, Stroke, Graft Survival, Retrospective Studies
Background
The number of deceased donor solid organ transplants has increased steadily over the past 15 years [1]. In solid organ transplantation, multiple donor characteristics are recorded and evaluated for potential implications on transplant outcomes. Included among these is donor cause of death (COD), which has been heretofore classified broadly into 5 categories: head trauma, cerebrovascular accident (CVA) or stroke, central nervous system (CNS) tumor, anoxia, and other causes.
Donor COD has been associated with outcomes in solid organ transplantation. In 2006, Feng et al identified that donors deceased from CVA/stroke are associated with an increased risk of 1-year graft loss for liver transplantation [2]. More recently, Winter et al developed a liver donor quality index (DQI) which identified donor COD as associated with liver transplant outcomes across multiple models [3]. Donor COD is notably also part of the kidney donor profile index (KDPI), which is predictive of graft survival and outcomes for kidney transplantation [4,5]. Heart transplant outcomes are also predicted by donor COD, with donors with head trauma showing improved long-term graft survival compared to those from other causes4[6]. Conversely, in lung transplantation, donors with traumatic brain injury showed no survival benefit compared to those from other causes [7].
Since the turn of the 21st century, the United States has seen the rise of the opioid epidemic, with an increasing number of deaths due to drug overdose [8]. The rise in opioid-related deaths is paralleled in the donor population, with the downstream effect of drug overdose deaths increasing the number of donors and solid organ transplants completed [9–11]. Simultaneously, the nation has seen a rise in the prevalence of obesity, hypertension, and diabetes, amongst other chronic comorbid conditions [12–14]. Heart disease and cardiovascular disease remain leading causes of mortality in the United States [15]. Both drug intoxication (DI) and cardiovascular (CV) COD are now grouped together under the umbrella of anoxia as donor COD in transplant reporting.
Current donor COD definitions are excessively broad and inadequately capture significant differences within the donor population, particularly when anoxia is utilized for COD reporting. We hypothesize that expanding donor COD by utilizing donor death mechanism information will reveal significant differences across the donor population and reveal the implications of COD for donor and organ utilization in the United States.
Material and Methods
POPULATION:
A retrospective cohort study was performed using the Organ Procurement and Transplant Network (OPTN) Standard Transplant Analysis and Research (STAR) file, which was evaluated for all potential deceased organ donors between January 1, 2005 and December 31, 2019. The study was deemed exempt from Institutional Review Board (IRB) approval due to utilization of deidentified data of deceased individuals. Donor characteristics evaluated included demographic variables: age, sex, ethnicity, height, weight, body mass index, and donation after brain death (DBD) or donation after circulatory death (DCD) status; medical/social history variables: diabetes, hypertension, prior myocardial infarction (MI), hepatitis C virus (HCV), hepatitis B virus (HBV), drug use, cigarette smoker (>20 pack-year history), alcohol use, or other high-risk criteria for transmission of blood-borne disease (eg, sex in exchange for money, intravenous drug use).
As previously stated, current reporting for donor COD includes head trauma, anoxia, CVA or stroke, CNS tumor, or other COD. Thirteen donor death mechanisms were evaluated, which include drowning, seizure, drug intoxication, asphyxiation, cardiovascular, electrical, gunshot wound, stab injury, blunt injury, sudden infant death syndrome (SIDS), intracranial hemorrhage or stroke, death from natural causes, or other death mechanisms. Specific definitions of each death mechanism do not exist and reporting is based on best medical evidence obtained by personnel involved in donor management and organ allocation. Evaluation of cross-over between COD and death mechanism yielded 6 expanded donor COD categories: trauma, CVA/Stroke, DI, CV, anoxia not otherwise specified (NOS), and other COD.
The primary outcome of interest was donor utilization, determined by procurement and transplantation of at least 1 solid organ. Multi-organ donors were defined as having at least 2 different organ types procured and transplanted (eg, kidney and lung) into 1 or more recipients; however, a donor of 2 lungs or 2 kidneys alone was not considered a multi-organ donor. Secondary outcomes of interest included variability among donors by expanded COD, time-dependent trends in donor COD, and organ-specific donor utilization.
LOGISTIC REGRESSION MODELING:
The likelihood of donor utilization across COD was evaluated by logistic regression modeling. Expanded COD definitions were used. Characteristics associated with donor utilization have been previously described and were used here for multivariable modeling [16]. Variables were included in the final model, even if they did not reach statistical significance, given their prior determination to associate with donor utilization. Variables included: donor age, sex, ethnicity, body mass index; medical history of diabetes, hypertension, prior myocardial infarction, hepatitis C virus, hepatitis B virus; social history of cigarette smoking; and terminal biochemical lab values of serum creatinine, alanine aminotransferase (ALT), and international normalized ratio (INR). Trauma COD had the highest likelihood of donor utilization in the 2005–2009 (Era 1) and therefore was used as the reference for all comparisons. DBD and DCD cohorts were evaluated separately.
DATA ANALYSIS:
Variables were compared across groups using
Results
POPULATION CHARACTERISTICS:
Between 2005 and 2019, 132 782 potential donors were identified. The median donor age was 42 years (interquartile range [IQR] 26–54 years) and 53 566 (40.3%) were female. The population was ethnically diverse with 88 209 (66.4%) identifying as White, 21 834 (16.4%) identifying as Black, and 18 509 (13.9%) as Hispanic. DCD donors accounted for 19 283 (14.5%) of donors. Current data recording practices identify 5 primary causes of death: head trauma (n=42 179, 31.8%), CVA/stroke (44 974, 33.9%), anoxia (41 559 (31.3%), and CNS tumor (614, 0.4%), with all remaining candidates considered as other (3457, 2.6%). Mechanism of death provides more detailed information on how potential donors died and includes: asphyxiation (5952, 4.4%), blunt trauma (28 650, 21.6%), cardiovascular ([CV] 20 053, 15.1%), drowning (1430, 1.1%), drug intoxication ([DI] 10 205, 7.7%), electrical (92, <0.1%), gunshot wound (11 716, 8.8%), intracranial hemorrhage (ICH) or stroke (46 212, 34.8%), natural causes (3428, 2.6%), seizure (1214, 0.9%), sudden infant death syndrome (141, 0.1%), stab wound (249, 0.2%), and other causes (3441, 2.6%).
EXPANSION OF DONOR COD:
Figure 1A depicts the distribution of donor death mechanism across traditional donor COD listing (raw data in Appendix A, Supplementary Table 1). Donors were then re-categorized into 6 COD that are more descriptive and aligned with death mechanism: trauma, CVA/stroke, cardiovascular death, drug intoxication (DI), anoxia not otherwise specified (NOS), and other. Figure 1B shows the cross-over between traditional COD and expanded COD. Table 1 presents selected demographic and historical characteristics of donors across the expanded COD definitions (all characteristics presented in Supplementary Table 2). Notably, donors with CV, DI, and anoxia-NOS causes of death were markedly different in age, BMI, and DCD status. Donors from DI were predominantly White (83.2%), while only 69.3% of CV and 69.0% of anoxia-NOS donors were White. CV donors had the highest rates of obesity (44.1%) and hypertension (21.9%), and second highest rate of diabetes (44.5%) with higher incidence only in donors from CVA/stroke (61.0%). Overall, 11.3% of CV donors had metabolic syndrome and 18.3% had 3 or more comorbid conditions. Notably, donors from DI had the highest rates of elevated AST (25.5%), ALT (30.9%), while donors with CV COD had the highest rates of elevated serum creatinine (SCr, >2.0 mg/dL; 27.2%). Differences across COD were significant (P<0.001) for all evaluated characteristics. Characteristics of all donors according to traditional COD classification are presented in Supplementary Table 3.
TRENDS IN DONOR COD OVER TIME:
Over time, there have been significant changes in the distribution of donors by expanded COD (Figure 2). In 2005–2009, CVA/stroke was the most common COD, accounting for 40.6% of donors, followed by trauma (37.2%). The proportion of donors from both trauma and CVA/stroke decreased over time. In 2015–2019, trauma was the most common COD among donors, but only accounted for 28.6% of donors. CVA/stroke further decreased as donor COD, accounting for 27.5% of donors in 2015–2019.
Donors from DI showed the greatest increase in proportion over the study period. In 2005–2009, DI was the least frequent COD, accounting for only 3.2% of donors. Between 2005–2009 and 2010–2014, the rate of DI as COD among donors nearly doubled to 5.9% of donors and then increased 2.6-fold in 2015–2019 to account for 12.5% of donors. Donors from CV as COD also increased considerably over the study period, from 10.8% of donors in 2005–2009 to 15.0% in 2010–2014, and 18.5% in 2015–2019.
TRENDS IN DCD DONATION:
These trends were evaluated among donors based on DBD and DCD status (Figure 2B, 2C). DBD donors reflected the same trends as the overall population with few exceptions. First, CVA/stroke was the most common COD throughout the study period, and in 2015–2019, the proportion of DBD donors from trauma was nearly equal to CVA/stroke, with 29.3% and 29.6% of donors, respectively. The distribution of donor COD differed across DCD donors. Trauma donors were the most common DCD donors, accounting for 35.8% of donors in 2005–2009 and decreasing to 25.9% in 2015–2019. Donors from CV and CVA/stroke each accounted for 23.0% of DCD donors in 2005–2009. Over the study period, CV donors increased to 24.3% of donors in 2015–2019, while CVA/stroke donors decreased to 18.7% of donors in 2015–2019. Donors from DI again showed the greatest change, increasing more than 3-fold over the study period, from 3.6% of DCD donors in 2005–2009 to 11.3% of donors in 2015–2019.
DONOR UTILIZATION:
Overall donor utilization rates varied across expanded COD (Table 2). Donors from trauma had the highest utilization rates (97.4%) and also donated multiple organs most frequently (79.4%). CV donors had the lowest overall utilization rate (90.1%) and least frequently donated multiple organs (n=7283, 72.4%). Figure 3 shows utilization rates by expanded COD for both DBD and DCD donors.
ORGAN UTILIZATION:
Donor utilization rates for each organ according to expanded COD are also presented in Table 2 (utilization by old COD presented in Supplementary Table 4). Donors with trauma COD had the highest utilization rate for all organs: 89.6% for kidneys, 79.7% for livers, 48.8% for hearts, 28.0% for lungs, and 24.6% for pancreas. Donors from DI had second highest utilization rate for liver (78.0%) and heart transplantation (36.9%, P<0.001 for all). CV donors had significantly lower utilization rates for kidneys (68.6%) and lungs and had lowest utilization rates for livers (65.4%), lungs (9.4%), and hearts (15.1%).
LOGISTIC REGRESSION ANALYSES FOR DONOR UTILIZATION:
The likelihood of donor utilization was compared across donor COD using multivariable models (eg, age, sex, ethnicity, medical comorbidities, and lab values), as shown in Table 3. Notably, donors were divided into DBD and DCD cohorts. First, the traditional COD classification was evaluated for donor utilization during the entire study period. Trauma was used as reference given that it had the highest utilization rate. Using these limited definitions, donors with trauma COD also had the highest likelihood of utilization. In comparison, the likelihood of DBD donor utilization for donors with anoxia as COD was OR 0.848 (95% CI 0.765–0.940) and when CVA/Stroke was COD was OR 0.684 (0.622–0.752, P<0.001). Similar trends were seen among DCD donors, with trauma donors again having the highest likelihood of utilization. There was a 31% decreased likelihood of donor utilization from DCD donors with anoxia COD (OR 0.687, 95% CI 0.597–0.791) and a 48% decreased likelihood of donor utilization from those with CVA/stroke COD (OR 0.517, 95% CI 0.443–0.602, P<0.001).
Using the expanded COD definitions significantly changed the likelihood of donor utilization. Importantly, among DBD donors, those from DI were more likely to be utilized than donors with trauma COD with OR 1.308 (95% CI 1.100–1.555,
LOGISTIC REGRESSION ANALYSES FOR ORGAN UTILIZATION:
Given that the highest likelihood for donor utilization was in 2015–2019 for all COD, the likelihood of organ-specific utilization was evaluated during these years using multivariable logistic regression analyses. DBD donors from trauma were the most likely to be utilized for heart, lung, and kidney transplantation (Figure 4). Interestingly, amongst DBD donors, those with DI as COD were the most likely to be utilized for liver transplantation (OR 1.378, 95% CI 1.227–1.548, P<0.001). Donors from CV as COD were least likely to be utilized for heart (OR 0.343, 95% CI 0.315–0.373) or lung transplantation (OR 0.433, 95% CI 0.396–0.472, P<0.001). Among DCD donors, there was no significant difference in likelihood of donor utilization across COD for liver transplantation (P=0.13). DCD donors with trauma COD were most likely to be utilized for kidney transplant, while donors from DI had 33% lower likelihood of utilization (OR 0.666, 95% CI 0.513–0.865) and those from CV as COD had 48% lower likelihood of utilization (OR 0.515, 95% CI 0.423–0.627, P<0.001). The utilization of DCD donors for heart and lung transplant during the 2015–2019 period was too low for multivariable analyses.
TEMPORAL TRENDS IN DONOR UTILIZATION:
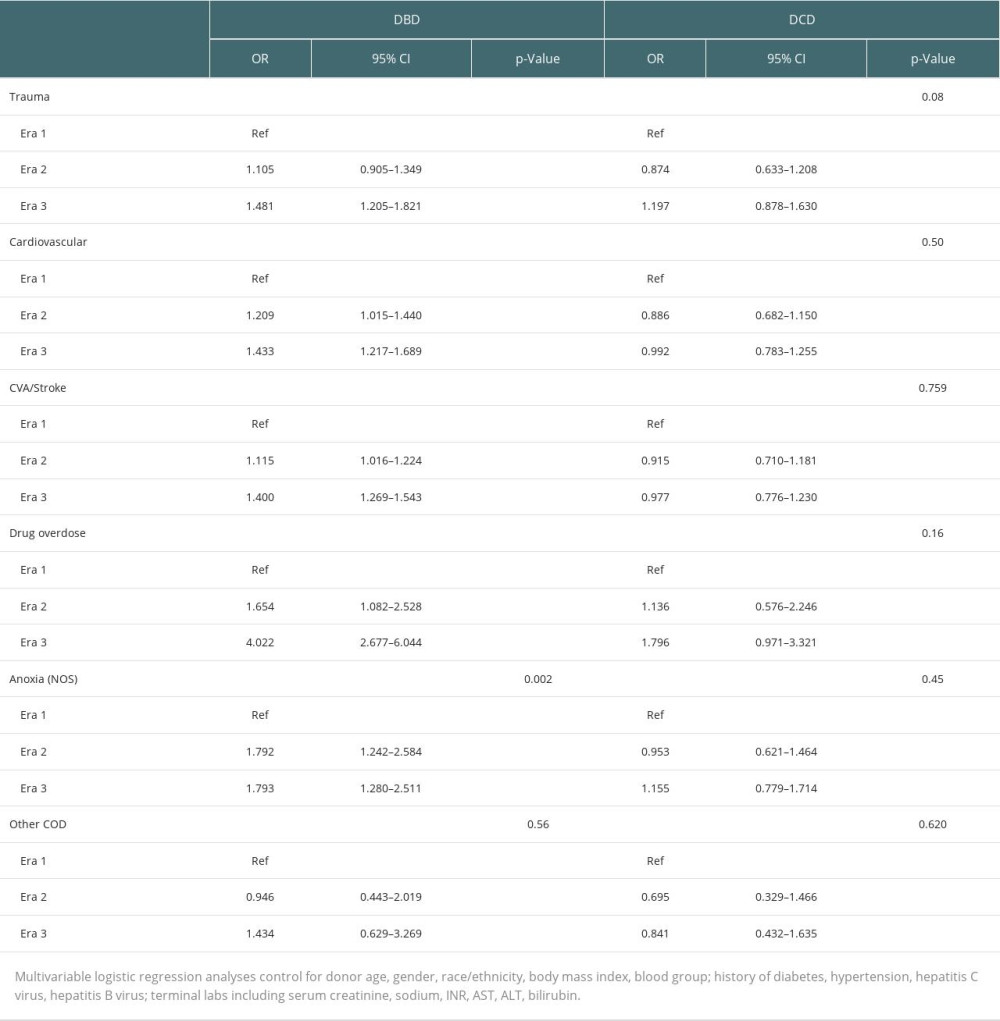
There were significant changes in donor utilization over time. For every COD, the likelihood of DBD donor utilization increased significantly between 2005–2009 and 2015–2019 (Table 4). DBD donors from DI showed the greatest increase over time, with a 400% increase in donor utilization from 2005–2009 to 2015–2019. However, even donors with CVA/stroke as COD, which were the least likely to be utilized overall, showed an increased likelihood of utilization between 2005–2009 and 2015–2019 (OR 1.400, 95% CI 1.269–1.543, P<0.001). Interestingly, among DCD donors, there were no significant changes in donor utilization over time for any COD.
Discussion
Donor COD is an important characteristic for donor evaluation, providing potentially significant information about the donor’s health status and risks of transplant. Currently, donor cause of death and death mechanism are recorded separately, making data reporting and interpretation difficult and potentially missing key variables in each. In this study, we propose refining donor COD definitions based on key death mechanism groups. Ultimately, 6 COD groups were identified: trauma, cardiovascular, CVA/stroke, drug intoxication, anoxia-NOS, and other COD. These groups are distinct in donor characteristics and reflective of differences in donor utilization practices.
The primary difference in the new classification is the development of CV, DI, and anoxia-NOS groups, which further stratify the traditional anoxia COD. This analysis found that the standard anoxia COD was an amalgamation of several subgroups with distinct donor characteristics and outcomes. Most importantly, donors from DI as COD were the fastest growing cohort of donors. These donors represented younger donors with fewer comorbid conditions and were the most likely utilized DBD donors of all COD. In sharp contrast to DI donors, the median age of CV donors was more than 10 years older than those in the anoxia-NOS and DI groups. CV donors also had higher BMIs and more comorbidities. Notably, the incidence of diabetes in the CV group is more than double the incidence in the DI and anoxia groups (44.5% vs 19.2% and 17.3%, respectively,
The impact of the opioid epidemic in our society cannot be overstated. In February 2018 Time Magazine published an issue titled “The Opioid Diaries”, devoting the entire issue to telling the stories of the opioid epidemic in the United States. This ongoing epidemic has increased the mortality of individuals across the United States over the past 30 years and lowered the life expectancy of Americans for the first time in generations [17–19]. The increase in mortality associated with opioid overdose is distributed across age groups; from 1997–2017 the mortality rate for those in the age group 25–34 years increased by 531.4%, by 267.9% for those 35–44 years, and by 350.9% for those 45–54 years [18]. This surge in drug intoxication-related deaths is demonstrated by DI being the fastest growing donor type among all groups in our study group. Amongst DBD donors, DI donors had a higher likelihood of utilization compared to trauma, while those with other COD were less likely to be utilized. This is not captured under the old categorization, with anoxia shown to have lower utilization than the trauma group.
A few studies have documented the increased number of grafts from DI donors [20–22]. Ising et al found the proportion of donor hearts from DI donors increased from 27% to 35% between 2005 and 2014, with a peak of 40.9% in 2010 [20]. A study of lung transplant donors found DI donors increased from 1.86% in 2005 to 6.19% in 2015 [22]. Historically, organs from DI donors may have been under-utilized secondary to being labeled increased-risk donors, but several studies have demonstrated no significant impact on mortality when increased-risk donors are utilized for transplant [23–25]. In a matched cohort of DI vs non-DI heart transplant donors, there was no significant difference in post-transplant survival at 1, 3, and 5 years – 90%, 82%, and 76% for DI donors versus 89%, 81%, and 74% for non-DI donors (
To the best of our knowledge, this is the first study to broadly evaluate and describe donors with CV as COD. These novel findings demonstrate important information on donor utilization practices. Within the new categorization, donors from CV had a lower likelihood of utilization among both DBD and DCD donors. When captured within the anoxia group under the old categorization, a higher likelihood of donor utilization was demonstrated. This new grouping more closely reflects the difference in this donor population. The comparatively lower utilization of CV donors is likely related to older age, higher BMIs, and an increased number of comorbidities, as this study demonstrates.
Although CV donors were the least likely to be utilized overall, they still showed an increased likelihood of utilization from 2005–2009 to 2015–2019 among DBD donors. Definitions of marginal donors have been variably defined across organ groups; however, most classifications generally include older patients, obese patients, and those with an increased number of comorbidities [2,26,27] Many donors in the CV group would be considered marginal donors according to these definitions; however, definitions of extended criteria donors are variable and dependent upon the organ of interest, which makes comparison difficult. This trend of increased utilization of CV donors is correlated with the increased utilization of marginal donors over the same time period. Recently, our group published a study showing increasing rates of obesity and other comorbid conditions in the donor population. Despite these changes, we found that these donors are more likely to be utilized for transplant now compared to 15 years ago [16].
Interestingly, donor utilization among DCD donors showed less variation across COD and over time. In contrast to DBD donors, where DI donors became the most likely to be utilized in recent years, donors from trauma remained the most likely DCD donors to be utilized in all time periods. One potential reason for this discrepancy may be differences in rates of progression to death upon withdrawal of care. In this present study, we did not evaluate reasons for organ discard, as information such as biopsy results or echocardiograms was not available for all donors. Nonetheless, this represents an interesting area for future research and may be most beneficial when evaluated on an organ-specific level.
Recently, there has been increased interest in the rates of organ non-utilization and donor selection. Selection and discard are dependent on multiple factors, including donor age, cause of death, and neurologic status (ie, DCD vs DBD). The present study showed increased rates of donor discard (organs which were recovered but not transplanted) for liver and kidney allografts when CV and CVA/Stroke were the donor COD. Donors in these groups were shown to have increased rates of diabetes, hypertension, and older age compared to donors from other COD, which likely influenced utilization. Interestingly, this study showed that the likelihood of donor utilization has increased over time for all COD among DBD donors; however, there was no difference in likelihood of donor utilization over time for any COD among DCD donors. In addition to donor characteristics influencing utilization, DCD carry the additional risks of warm ischemic time and worse ischemia reperfusion injury, which may impact outcomes [28]. While many studies consider DCD donation as individual risk factor, we placed them in separate cohorts to remove that bias. The lack of change in utilization over time for DCD donors supports the notion that challenges inherent to DCD donation override many conventional risk factors.
The present study expands the definitions of donor COD to allow comparison across more descriptive groups; however, it is not without limitations. An important limitation is the dependency of defining COD by medical information provided to procurement personnel. While some death mechanisms are very clear cut, such as head trauma, others remain murky, such as seizure, which may arise from a stroke but results in anoxia. In these instances, COD reporting may be incomplete or insufficient; however, between 13 identified death mechanisms and the small proportion that do not fall into the primary categories evaluated here (ie, trauma, CVA/stroke, CV, and DI), this limitation is unlikely to significantly alter the results of this study. The use of the large OPTN STAR file database is a primary limitation of this study. While providing a large amount of data over an extensive time period, large databases are known to be subject to error. Furthermore, donors may be excluded due to missing variables or incorrect data entry. However, given the large study population, the number of excluded individuals is negligible and minor errors are unlikely to alter the conclusions of this study. Second, donor death was recorded across 3 variables: donor cause of death, death mechanism, and death circumstance. While we have expanded the donor COD to 6 categories, there may be additional nuances that are missed. Nonetheless, we have identified 6 distinct donor profiles and shown significant differences in utilization practices. Lastly, this study does not evaluate outcomes from organ transplantation but focused solely on donor characteristics and utilization. Additional work should be considered to evaluate the roles of more defined COD on organ-specific outcomes.
Expanding the definitions of donor COD has captured differences in the donor population and changes over time that are not adequately captured in the current categorization. DI donors are a rapidly growing group that require further analysis and exploration. This novel study provides a better understanding of the donor pool and the characteristics of these donors, which is reflected in differing donor utilization practices. This will help guide future studies investigating maximization of organ utilization in the future.
Conclusions
With the donor pool evolving, current donor COD classifications do not adequately encompass the differences within the donor population. Based on our new expanded donor COD definitions, donors from DI are the fastest growing donor type and multivariable analysis showed that DI donors had the highest likelihood for donor utilization among DBD donors. Expanding COD definitions better reflects differences in donor characteristics across the donor population and its implications on donor utilization for solid organ transplantation.
Figures
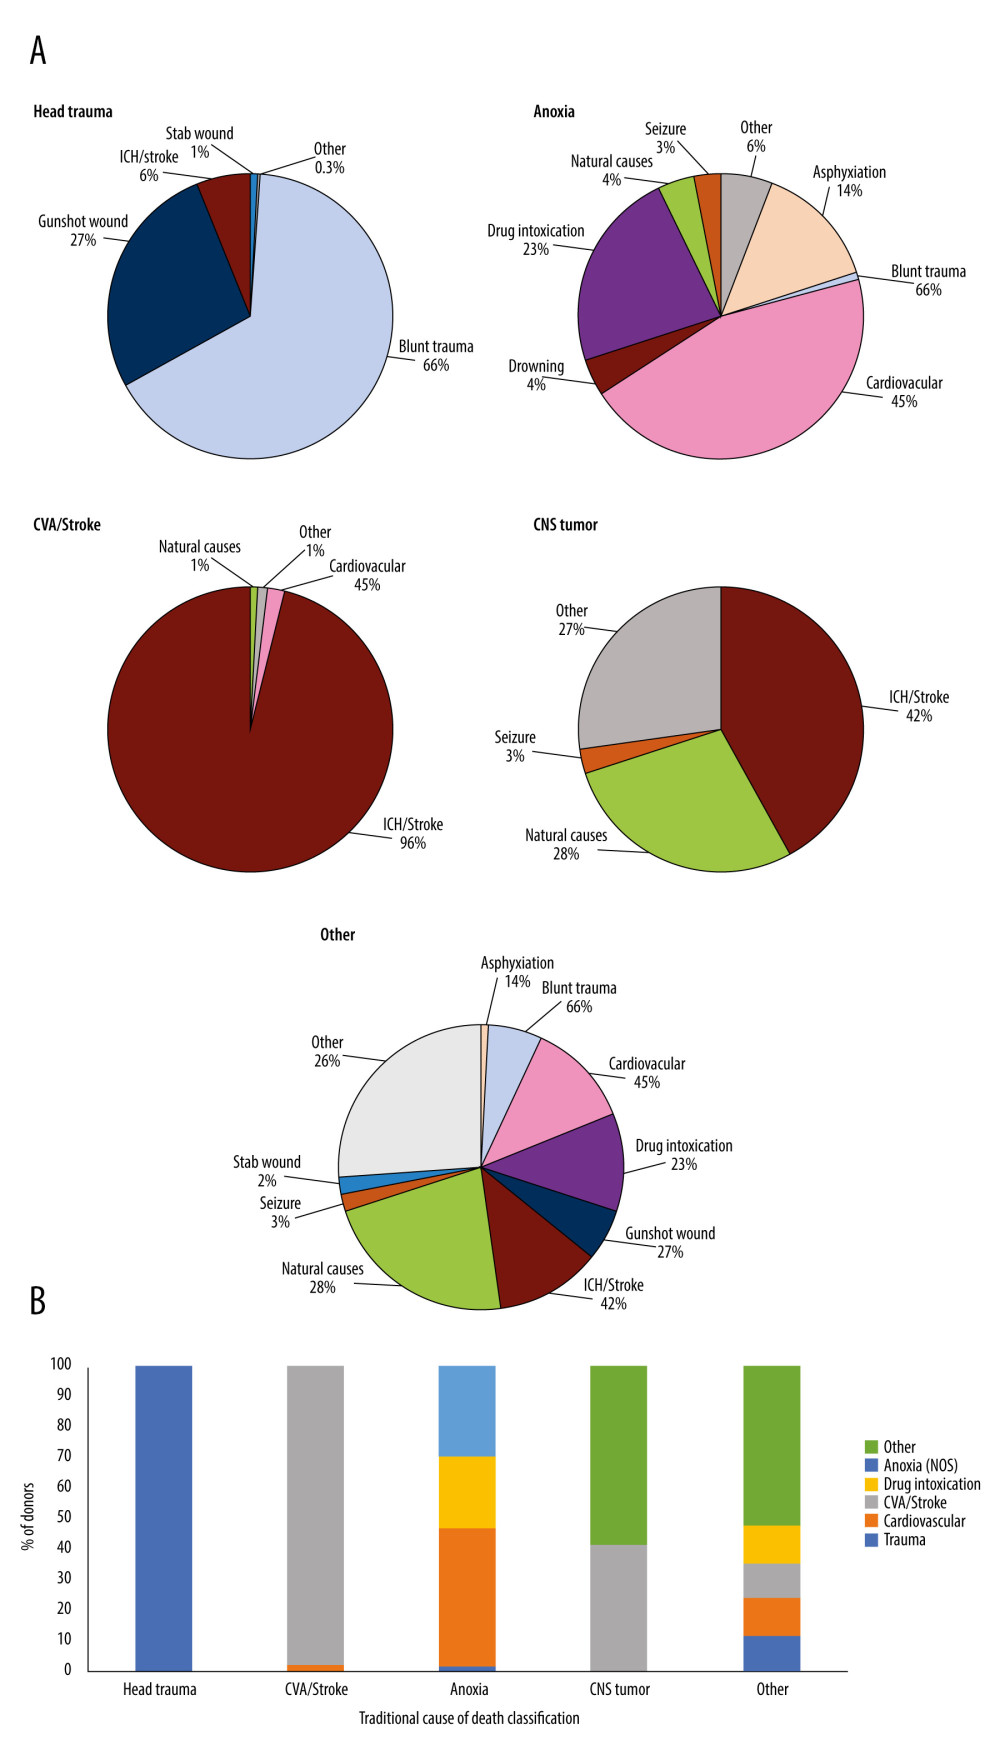 Figure 1. (A) Distribution of donor death mechanism across traditional donor COD listing: Head trauma, Anoxia, CVA/Stroke, CNS/Tumor, Other. All death mechanisms accounting for <1% of donor deaths were combined into “Other” category. These included for Head Trauma: natural causes (0.1%), seizure (0.1%), and other (0.1%); CVA/Stroke: drug intoxication (0.3%), seizure (0.1%), and other (0.4%); Anoxia: gunshot wound (0.6%), stab wound (0.4%), SIDS (0.3%), electrical (0.2%), and other (4.2%); CNS Tumor: other (26.6%); Other: electrocution (0.4%), drowning (0.2%), SIDS (0.1%), and other (25.6%). (B) Cross-over between old cause of death definitions and expanded cause of death definitions. Created using Microsoft Excel 2021.
 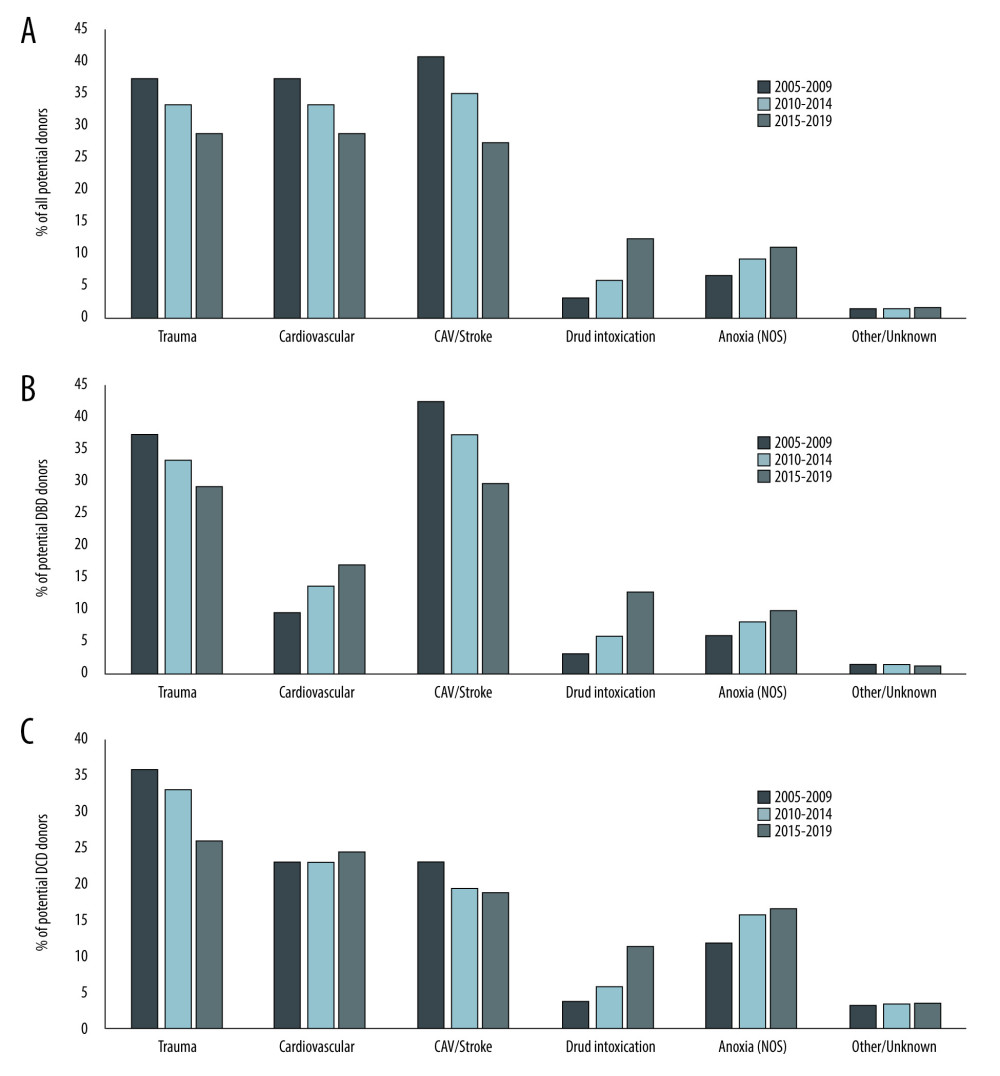 Figure 2. Trends in donor cause of death over time. Changes in the distribution of donor cause of death between 2005 and 2019 using expanded definitions is shown for A) all donors, B) donation after brain death donors, and C) donation after circulatory death donors. Created using Microsoft Excel 2021.
 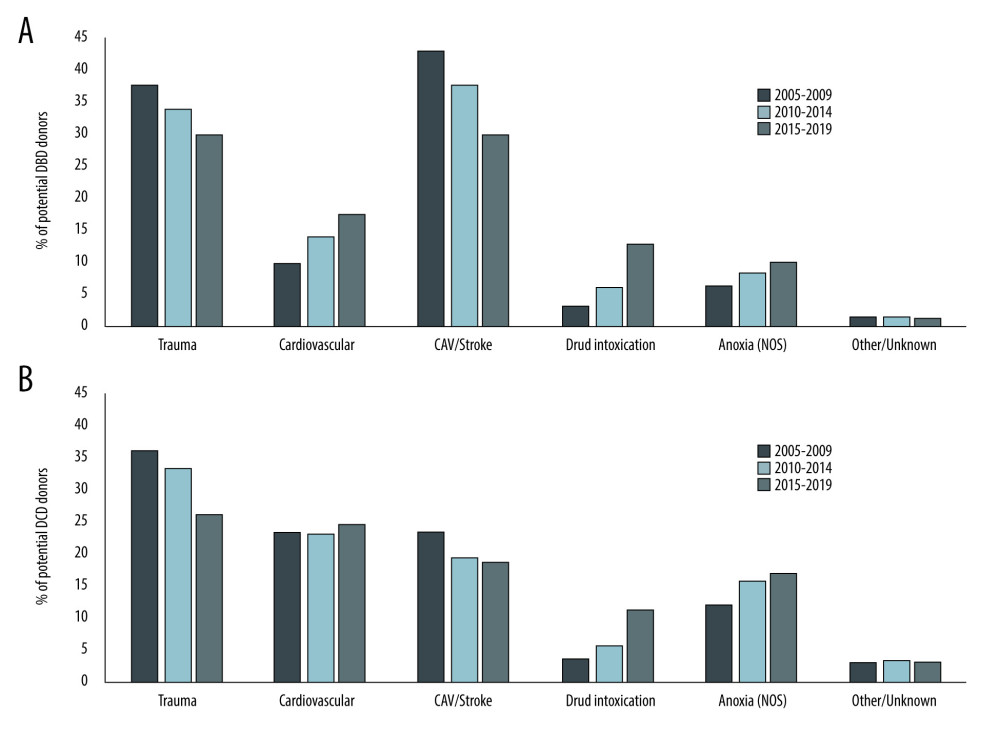 Figure 3. Trends in Donor Utilization Over Time. Changes in donor utilization rates according to expanded cause of death definitions between 2005 and 2019 for A) donation after brain death donors and B) donation after circulatory death donors. Created using Microsoft Excel 2021.
 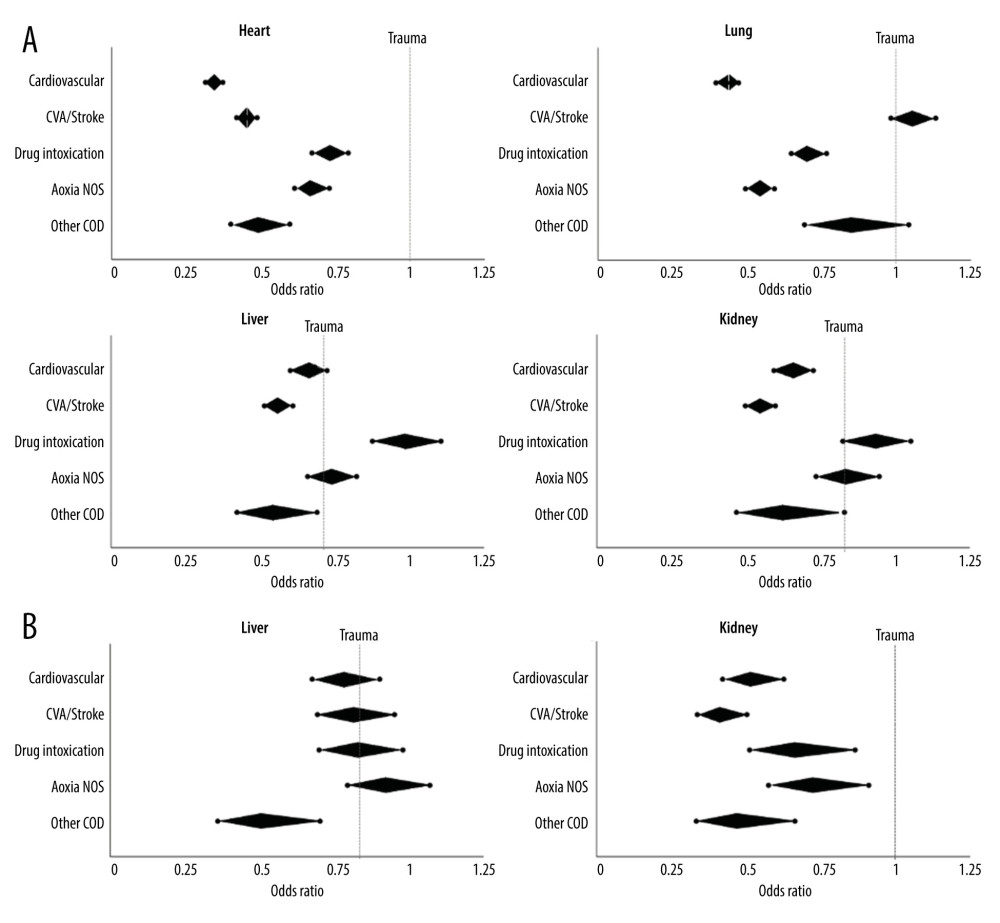 Figure 4. Likelihood of Organ Utilization in 2015–2019. Multivariable analysis was performed for likelihood of organ utilization across expanded donor COD in the most recent study era. Odds ratios (middle point of diamond) and 95% confidence intervals (end-points) are shown for each donor cause of death compared to trauma (odds ratio 1.0, dotted line) for A) heart, lung, liver, and kidney transplant using donation after brain death donors; and B) liver and kidney transplant using donation after circulatory death donors. Created using Microsoft Excel 2021.
 Tables
Table 1. Selected characteristics of donors by expanded cause of death.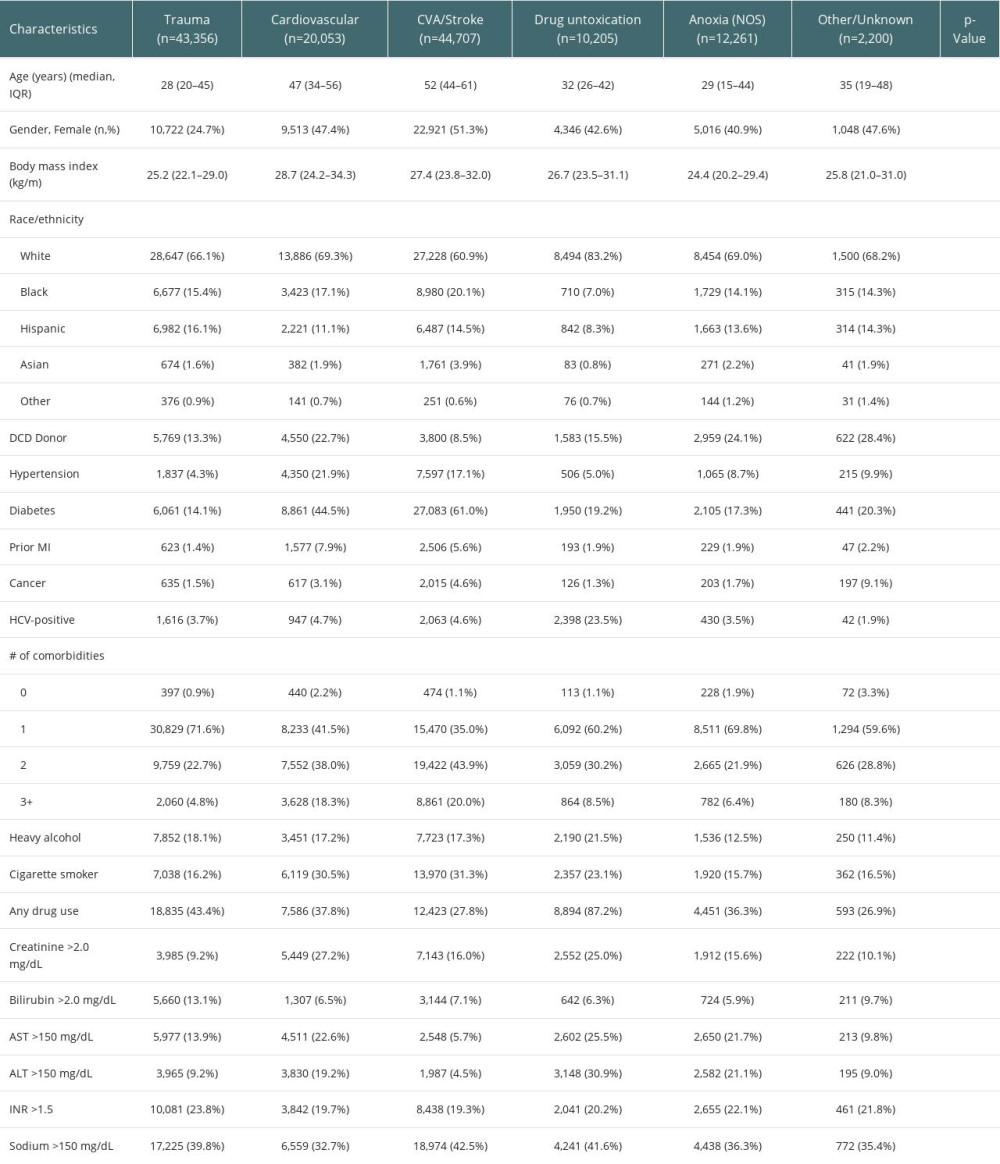 Table 2. Organ-specific donor utilization by expanded cause of death.
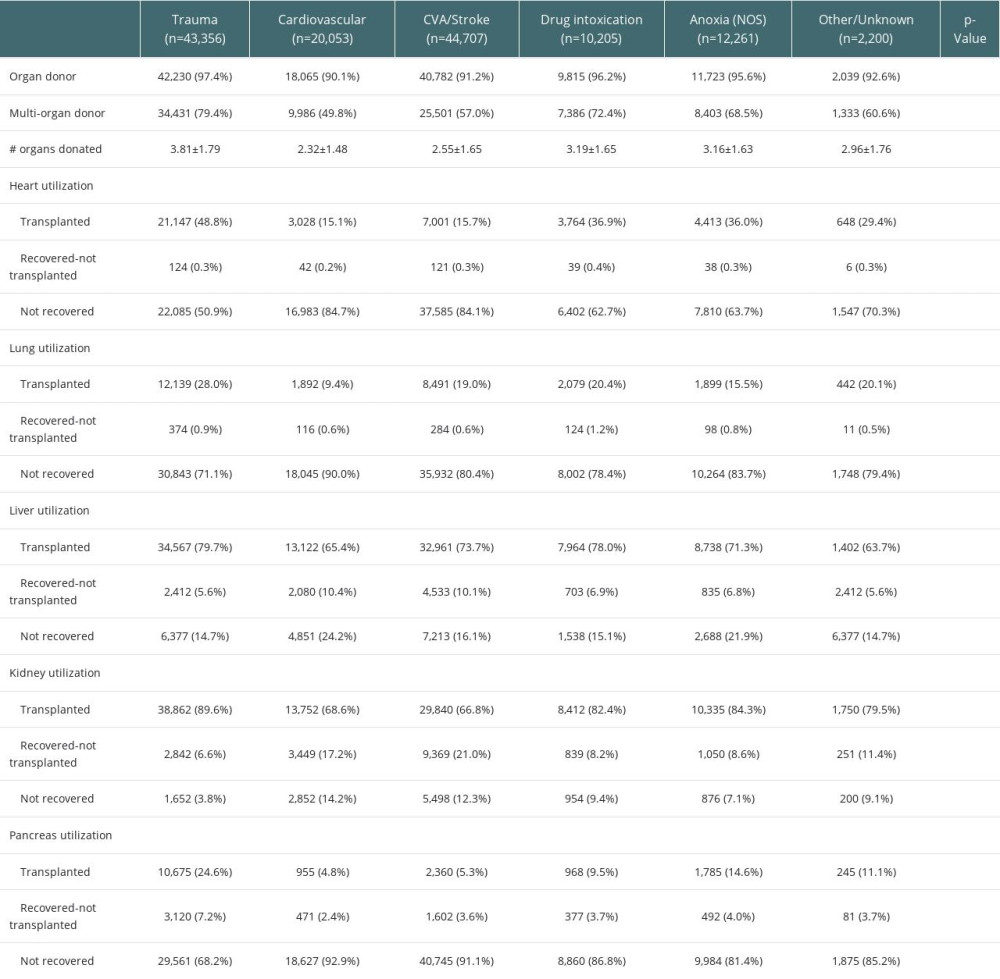 Table 3. Multivariable analysis of donor utilization by primary and expanded cause of death.
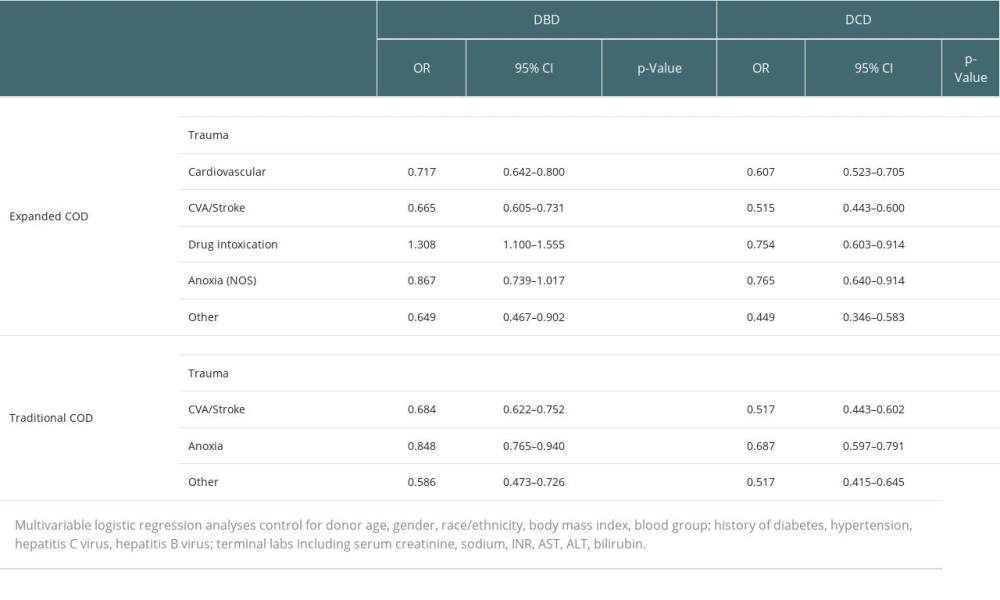 Table 4. Changes in likelihood of donor utilization over time.
References
1. Israni AK, Zaun D, Gauntt K, OPTN/SRTR 2020 Annual data report: DOD: Am J Transplant, 2022; 22(Suppl 2); 519-52
2. Feng S, Goodrich NP, Bragg-Gresham JL, Characteristics associated with liver graft failure: The concept of a donor risk index: Am J Transplant, 2006; 6(4); 783-90 [Erratum in: Am J Transplant. 2018;18(12) : 3085]
3. Winter A, Féray C, Audureau E, A Donor Quality Index for liver transplantation: Development, internal and external validation: Sci Rep, 2018; 8(1); 9871 [Erratum in: Sci Rep. 2018;8(1):15109]
4. Watson CJ, Johnson RJ, Birch R, A simplified donor risk index for predicting outcome after deceased donor kidney transplantation: Transplantation, 2012; 93(3); 314-18
5. Rao PS, Schaubel DE, Guidinger MK, A comprehensive risk quantification score for deceased donor kidneys: the kidney donor risk index: Transplantation, 2009; 88(2); 231-36
6. Ram E, Lavee J, Freimark D, Improved long-term outcomes after heart transplantation utilizing donors with a traumatic mode of brain death: J Cardiothorac Surg, 2019; 14(1); 138
7. Crawford TC, Lui C, Magruder JT, Traumatically brain-injured donors and the impact on lung transplantation survival: Ann Thorac Surg, 2018; 106(3); 842-47
8. Spencer MR, Miniño AM, Warner M, Drug overdose deaths in the United States, 2001-2021: NCHS Data Brief, 2022(457); 1-8
9. Durand CM, Bowring MG, Thomas AG, The drug overdose epidemic and deceased-donor transplantation in the United States: A national registry study: Ann Intern Med, 2018; 168(10); 702-11
10. Mehra MR, Jarcho JA, Cherikh W, The drug-intoxication epidemic and solid-organ transplantation: N Engl J Med, 2018; 378(20); 1943-45
11. Vaduganathan M, Machado SR, DeFilippis EM, Organ donation and drug intoxication-related deaths in the United States: N Engl J Med, 2019; 380(6); 597-99
12. Wang Y, Beydoun MA, Min J, Has the prevalence of overweight, obesity and central obesity levelled off in the United States? Trends, patterns, disparities, and future projections for the obesity epidemic: Int J Epidemiol, 2020; 49(3); 810-23
13. Flegal KM, Kruszon-Moran D, Carroll MD, Trends in obesity among adults in the United States, 2005 to 2014: JAMA, 2016; 315(21); 2284-91
14. Hirode G, Wong RJ, Trends in the prevalence of metabolic syndrome in the United States, 2011–2016: JAMA, 2020; 323(24); 2526-28
15. Sidney S, Quesenberry CP, Jaffe MG, Recent trends in cardiovascular mortality in the United States and public health goals: JAMA Cardiol, 2016; 1(5); 594-99
16. Steggerda JA, Ladner DP, Kim IK, A retrospective evaluation of changing health characteristics amongst deceased organ donors in the United States: Transplant Proc, 2023; 55(2); 251-62
17. Rummans TA, Burton MC, Dawson NL, How good intentions contributed to bad outcomes: The opioid crisis: Mayo Clin Proc, 2018; 93(3); 344-50
18. Woolf SH, Schoomaker H, Life expectancy and mortality rates in the United States, 1959–2017: JAMA, 2019; 322(20); 1996-2016
19. Goldberg DS, Blumberg E, McCauley M, Improving organ utilization to help overcome the tragedies of the opioid epidemic: Am J Transplant, 2016; 16(10); 2836-41
20. Ising MS, Gallo M, Whited WM, Changing demographics of heart donors: The impact of donor drug intoxication on posttransplant survival: Am J Transplant, 2018; 18(7); 1790-98
21. Warraich HJ, Lu D, Cobb S, Trends and outcomes of cardiac transplantation from donors dying of drug intoxication: Am Heart J, 2018; 199; 92-96
22. Whited WM, Ising MS, Trivedi JR, Use of drug intoxicated donors for lung transplant: Impact on survival outcomes: Clin Transplant, 2018; 32(5); e13252
23. Shudo Y, Cohen JE, Lingala B, Impact of “increased-risk” donor hearts on transplant outcomes: A propensity-matched analysis: J Thorac Cardiovasc Surg, 2019; 157(2); 603-10
24. Brown CS, Wakam GK, Englesbe MJ, Increased-risk donors and solid organ transplantation: Current practices and opportunities for improvement: Curr Opin Organ Transplant, 2020; 25(2); 139-43
25. Trotter PB, Summers DM, Robb M, Deceased organ donors with a history of increased risk behavior for the transmission of blood-borne viral infection: The UK experience: Transplantation, 2017; 101(7); 1679-89
26. Weiss ES, Allen JG, Kilic A, Development of a quantitative donor risk index to predict short-term mortality in orthotopic heart transplantation: J Heart Lung Transplant, 2012; 31(3); 266-73
27. Zhang T, Dunson J, Kanwal F, Trends in outcomes for marginal allografts in liver transplant: JAMA Surg, 2020; 155(10); 926-32 [Erratum in: JAMA Surg. 2020;155(10) :1002]
28. Ruck JM, Jackson KR, Motter JD, Temporal trends in utilization and outcomes of DCD livers in the United States: Transplantation, 2022; 106(3); 543-51
Figures
 Figure 1. (A) Distribution of donor death mechanism across traditional donor COD listing: Head trauma, Anoxia, CVA/Stroke, CNS/Tumor, Other. All death mechanisms accounting for <1% of donor deaths were combined into “Other” category. These included for Head Trauma: natural causes (0.1%), seizure (0.1%), and other (0.1%); CVA/Stroke: drug intoxication (0.3%), seizure (0.1%), and other (0.4%); Anoxia: gunshot wound (0.6%), stab wound (0.4%), SIDS (0.3%), electrical (0.2%), and other (4.2%); CNS Tumor: other (26.6%); Other: electrocution (0.4%), drowning (0.2%), SIDS (0.1%), and other (25.6%). (B) Cross-over between old cause of death definitions and expanded cause of death definitions. Created using Microsoft Excel 2021.
 Figure 2. Trends in donor cause of death over time. Changes in the distribution of donor cause of death between 2005 and 2019 using expanded definitions is shown for A) all donors, B) donation after brain death donors, and C) donation after circulatory death donors. Created using Microsoft Excel 2021.
 Figure 3. Trends in Donor Utilization Over Time. Changes in donor utilization rates according to expanded cause of death definitions between 2005 and 2019 for A) donation after brain death donors and B) donation after circulatory death donors. Created using Microsoft Excel 2021.
 Figure 4. Likelihood of Organ Utilization in 2015–2019. Multivariable analysis was performed for likelihood of organ utilization across expanded donor COD in the most recent study era. Odds ratios (middle point of diamond) and 95% confidence intervals (end-points) are shown for each donor cause of death compared to trauma (odds ratio 1.0, dotted line) for A) heart, lung, liver, and kidney transplant using donation after brain death donors; and B) liver and kidney transplant using donation after circulatory death donors. Created using Microsoft Excel 2021.
 Tables
 Table 1. Selected characteristics of donors by expanded cause of death.
 Table 2. Organ-specific donor utilization by expanded cause of death.
 Table 3. Multivariable analysis of donor utilization by primary and expanded cause of death.
 Table 4. Changes in likelihood of donor utilization over time.
 Table 1. Selected characteristics of donors by expanded cause of death.
 Table 2. Organ-specific donor utilization by expanded cause of death.
 Table 3. Multivariable analysis of donor utilization by primary and expanded cause of death.
 Table 4. Changes in likelihood of donor utilization over time.
 In Press
28 Mar 2024 : Original article
Association Between FEV₁ Decline Rate and Mortality in Long-Term Follow-Up of a 21-Patient Pilot Clinical T...Ann Transplant In Press; DOI: 10.12659/AOT.942823
02 Apr 2024 : Original article
Liver Transplantation from Brain-Dead Donors with Hepatitis B or C in South Korea: A 2014-2020 Korean Organ...Ann Transplant In Press; DOI: 10.12659/AOT.943588
02 Apr 2024 : Original article
Effect of Dexmedetomidine Combined with Remifentanil on Emergence Agitation During Awakening from Sevoflura...Ann Transplant In Press; DOI: 10.12659/AOT.943281
03 Apr 2024 : Review article
Alternative Therapies in Transplantology as a Promising Perspective in MedicineAnn Transplant In Press; DOI: 10.12659/AOT.943387
Most Viewed Current Articles
05 Apr 2022 : Original article
Impact of Statins on Hepatocellular Carcinoma Recurrence After Living-Donor Liver TransplantationDOI :10.12659/AOT.935604
Ann Transplant 2022; 27:e935604
12 Jan 2022 : Original article
Risk Factors for Developing BK Virus-Associated Nephropathy: A Single-Center Retrospective Cohort Study of ...DOI :10.12659/AOT.934738
Ann Transplant 2022; 27:e934738
22 Nov 2022 : Original article
Long-Term Effects of Everolimus-Facilitated Tacrolimus Reduction in Living-Donor Liver Transplant Recipient...DOI :10.12659/AOT.937988
Ann Transplant 2022; 27:e937988
15 Mar 2022 : Case report
Combined Liver, Pancreas-Duodenum, and Kidney Transplantation for Patients with Hepatitis B Cirrhosis, Urem...DOI :10.12659/AOT.935860
Ann Transplant 2022; 27:e935860


