12 January 2021: Original Paper
Suppression of Allograft Fibrosis by Regulation of Mammalian Target of Rapamycin-Related Protein Expression in Kidney-Transplanted Recipients Treated with Everolimus and Reduced Tacrolimus
Shun Nishioka1ABCDE, Takeshi Ishimura1ACDE*, Takahito Endo1B, Naoki Yokoyama1BC, Satoshi Ogawa1BCD, Masato Fujisawa1EDOI: 10.12659/AOT.926476
Ann Transplant 2021; 26:e926476


Abstract
BACKGROUND: Although renoprotective effects of everolimus (EVR) in kidney transplantation (KTx) have been widely reported, its pathophysiological mechanism remains unclear.
MATERIAL AND METHODS: We compared changes in eGFR (ΔGFR, ml/min/1.73 m²) and the ratio of the fibrotic area in biopsy specimens (ΔFI,%) from 3 months to 3 years after KTx between the EVR+ group (EVR addition and Tac reduction early after KTx, n=32), and the EVR– group (normal Tac without EVR, n=28). We also immunohistochemically evaluated mTOR-related protein expression.
RESULTS: ΔGFR and ΔFI in the EVR+ vs. EVR– groups were –0.27±6.8 vs. –9.8±12.8 (p<0.001) and 2.4±4.9 vs. 9.5±10.5 (p<0.001), respectively. Phosphorylated mTOR and phosphorylated 4EBP1 expression at 3 years in the EVR+ group was significantly lower than that in the EVR– group. Moreover, in the subgroup analysis comparing ΔGFR and ΔFI among groups stratified by immunosuppressive regimen and mTOR signal enhancement, the ΔFI in patients with EVR+ with decreased mTOR signal enhancement was significantly milder than that in other patients. In addition, in the multivariate analysis, EVR addition was the only independent predictor for allograft fibrosis, whereas the Tac C₀ concentration at neither 1 nor 3 years proved to be a risk factor.
CONCLUSIONS: These results suggested that EVR addition and Tac reduction may attenuate kidney allograft fibrosis, and that the suppression of mTOR signaling process may be involved in the anti-fibrotic effect of this immunosuppressive regimen. These results provide suggestions of how to utilize EVR for patients with KTx and improve graft function.
Keywords: Fibrosis, Immunohistochemistry, Kidney Transplantation, TOR Serine-Threonine Kinases, adult, Allografts, Everolimus, Female, Graft Rejection, Humans, Immunosuppressive Agents, Kidney, Male, Middle Aged, Tacrolimus, transplant recipients
Background
Refinements in immunosuppressive therapies have reduced acute rejection episodes and improved short-term allograft survival of patients who undergo kidney transplantation (KTx). However, such improvements have not been correspondingly translated into long-term graft survival, owing to immunological factors, such as
Several efforts have focused on improving long-term graft survival, including new immunosuppressive protocols containing either everolimus (EVR) or sirolimus (SRL), so-called inhibitors of mammalian target of rapamycin (mTOR-i).
These drugs exert potent immunosuppressive effects that inhibit the proliferation of T cells without nephrotoxicity. A number of prospective controlled trials have added mTOR-i to immunosuppressive protocols in the early phase of KTx, which concomitantly avoids, eliminates, or minimizes CNIs. Most of these trials have successfully demonstrated favorable effects on preserving renal functions without increasing the frequency of rejection episodes [3–5]. However, it is unclear whether the improved renal functions observed using these new immunosuppressive protocols are caused by a simple hemodynamic alteration due to the absence or reduction of functional vasoconstrictive effects by CNIs or amelioration of specific histological findings. Because these new immunosuppressive protocols using mTOR-i are becoming widely used, there appears to be an increasing need to clarify the histological features and underlying molecular mechanisms ensuring the validity of these strategies.
Mammalian target of rapamycin (mTOR), a serine-threonine kinase, exists as 2 complexes (mTORC1 and mTORC2) that regulate cellular functions such as proliferation, differentiation, metabolism, migration, and angiogenesis through functional control of its downstream proteins such as ribosomal protein 70S6 kinase (p70S6K) and eukaryotic initiation factor 4E-binding protein-1 (4EBP-1) [6,7]. Recently, it has become clear that mTOR signaling plays a crucial role in the regulation of tissue fibrosis, including chronic kidney disease [8]. Furthermore, in the context of kidney-transplanted patients, our previous report indicated the involvement of mTOR-related protein expression in the development of interstitial fibrosis after KTx [9,10].
Combining these influences of mTOR-related proteins on the progression of interstitial fibrosis after KTx with the fact that mTOR-i regulates the expression of mTOR-related proteins, it can be postulated that preserved allograft functions in KTx patients treated with mTOR-i are in part due to improvement of interstitial fibrosis via regulation of the mTOR pathway. In this study, we determined the expression profile of proteins involved in the mTOR signaling pathway in sequential routine biopsies after KTx. To clarify the mechanism of the favorable effects of mTOR-i used concomitantly with reduced CNIs on kidney graft functions, we compared renal functions and the degree of interstitial fibrosis progression, as well as the expression of mTOR-related proteins between patients treated with EVR-based tacrolimus (Tac)-reduced immunosuppression or conventional normal Tac-based immunosuppression without EVR.
Material and Methods
PATIENT SELECTION:
From January 2006 to May 2016, 167 patients underwent KTx at Kobe University Hospital, Kobe, Japan. We had employed an immunosuppressive protocol including CNIs (Tac or cyclosporine A; CyA), mycophenolate mofetil (MMF), and methylprednisolone (mPSL) until March 2013. Starting in April 2013, we changed the immunosuppressive protocol by adding EVR to the abovementioned triple immunosuppression at 3 months after KTx, followed by reduction of the Tac dose. A core-needle biopsy of the kidney allograft was performed in all patients during both time periods under ultrasonographic guidance with a biopsy gun (18 G; CR Bard, Covington, GA, USA) at 3 months and 3 years after KTx. We recruited patients who were: 1) negative for flow cytometry cross-match before KTx, 2) treated with Tac as the CNI, and 3) >18 years of age at the time of KTx. We excluded patients who: 1) experienced clinical or subclinical rejection or recurrent nephropathy confirmed by core-needle biopsy at 3 months after KTx, 2) had deteriorated renal functions 3 months after KTx, i.e., estimated glomerular filtration rate (eGFR) <25 ml/min/1.73 m2 or proteinuria >0.5 g/gCr at 3 months after KTx, 3) were administered EVR later than 3 months after KTx, and 4) with insufficient tissue in their biopsy at either 3 months or 3 years after KTx. Eventually, of the remaining 60 patients, 32 patients were administered EVR at 3 months after KTx and allocated to the EVR+ group. Twenty-eight patients were maintained on conventional Tac-based immunosuppression without EVR and allocated to the EVR− group (Figure 1). The study protocol was approved by the Research Ethics Committee of Kobe University Hospital. Informed consent was obtained from each patient before enrollment.
IMMUNOSUPPRESSIVE THERAPY:
In both groups, Tac was administered intravenously for 3 or 4 days and then orally, to achieve an optimal trough concentration (C0). The Tac C0 was set at 8–10, 6–8, and approximately 5 ng/mL in the first, second, and third months after KTx, respectively. We administered 30-mg/kg MMF and a 500-mg bolus dose of mPSL on the day of KTx, tapering to 0.1 mg/kg in the first month after KTx, and 20-mg/kg basiliximab on the day of KTx and 4 days after KTx in all the patients. At 3 months after KTx, patients in the EVR+ group were administered EVR at an initial dose of 1.5 mg per day followed by reduction of the Tac dose. The targeted C0 of Tac and EVR after addition of EVR were 2.5–3.0 ng/ml and 3–8 ng/ml, respectively. Patients in the EVR− group continued Tac-based immunosuppression without EVR, in which the targeted C0 of Tac was maintained at around 5 ng/ml.
EVALUATION OF RENAL FUNCTIONS, INTERSTITIAL FIBROSIS, AND PATHOLOGICAL FINDINGS:
For each patient, we used the estimated glomerular filtration rate (eGFR) calculation formula according to the modified equation for Japanese patients proposed by the Japanese Society of Nephrology for the evaluation of renal function [eGFR (mL/min/1.73 m2)=194×serum creatinine mg/dL−1.094×age−0.287 (×0.739, if female)].
To assess the decline in graft function, we defined ΔeGFR as the change in eGFR from 3 months to 3 years after KTx; that is, ΔeGFR=eGFR at 3 years – eGFR at 3 months. To quantify the degree of interstitial fibrosis in the grafted kidney, we applied an image analysis system to Masson’s trichrome-stained biopsy specimens as previously reported [10,11]. In brief, we performed Masson’s trichrome staining of biopsy specimen sections at 3 months and 3 years after KTx and examined the sections under a microscope equipped with a digital camera system (Keyence America, Nashville, TN, USA). We then collected the digital images of the biopsy specimens from the renal cortex in longitudinal view. Finally, we analyzed the collected digital images using ImageJ software (National Institutes of Health, Bethesda, MD, USA). We set the threshold for the thickness of the blue color stain of Masson’s trichrome to quantify the fibrotic area in the specimen. We defined the percentage of the total area of fibrotic interstitium in the biopsy section as the fibrosis index (FI,%), and the change in the FI from 3 months to 3 years after KTx as ΔFI; that is, ΔFI=FI at 3 years after KTx – FI at 3 months after KTx. The average of 3 FI measurements was used in this study. Evidence of the progression of allograft fibrosis was defined as a ΔFI of >10%, whereas a stable graft had a ΔFI of ≤10% in this study. Each biopsy was also evaluated and diagnosed according to the Banff 2007 working classification and scored 0 to 3 for chronic interstitial fibrosis (ci), chronic tubular atrophy (ct), chronic allograft glomerulopathy (cg), chronic vascular fibrous intimal thickening (cv), peritubular capillaritis (ptc), and hyaline arteriolar thickening (aah), respectively.
IMMUNOHISTOCHEMISTRY:
We performed immunohistochemical staining using 5 anti-human antibodies, namely anti-phosphorylated Akt (p-Akt: Ser473; Cell Signaling, Beverly, MA, USA) at a 100-fold dilution; anti-Rheb (Abcam, Cambridge, UK) at a 200-fold dilution; anti-phosphorylated mTOR (p-mTOR: Ser2448; Cell Signaling) at a 100-fold dilution; anti-phosphorylated 4EBP1 (p-4EBP-1: Thr37/46; Cell Signaling) at a 200-fold dilution; and anti-phosphorylated p70S6K (p-p70S6K: Thr389; Cell Signaling) at a 200-fold dilution [10]. Two independent investigators who were blinded to the clinicopathological diagnosis evaluated the staining. The percentage of area positively stained by each antibody was scored as follows: 0, <5%; 1, 5–15%; 2, 16–30%; and 3, >30%.
STATISTICAL ANALYSIS:
All statistical analyses were conducted using R version 3.3.1, and the threshold for significance was
Results
STUDY POPULATION AND IMMUNOSUPPRESSION:
Thirty-two patients were allocated to the EVR+ group, and 28 patients were in the EVR− group. All patients recruited in this study completed the immunosuppressive protocol and were free from acute/chronic rejections or recurrent nephropathy during the study period of 3 years. The 3-year patient and graft survival rates were 100% in both EVR+ and EVR− groups. Donor-specific anti-HLA antibodies were not regularly screened for patients who were negative for cross-match before and after KTx in our institute. Baseline characteristics of the patients in both groups are shown in Table 1. The values of Tac C0 and EVR C0 in both groups are presented in Figure 2. Tac C0 in EVR+ and EVR− groups were almost the same at 3 months after KTx, just before initiating EVR (6.42±1.24 vs. 6.79±1.35 ng/ml). From 3 months to 3 years after KTx, Tac C0 was maintained in the range of 3–4 ng/ml in the EVR+ group and 5–7 ng/ml in the EVR− group, which were slightly higher values in both groups than the targeted C0. EVR C0 was adjusted to the range of 6–8 ng/ml in the EVR+ group until 3 years after KTx. In the EVR+ group, the incidences of dyslipidemia, urinary protein, and stomatitis were higher than in the EVR− group. However, all of these adverse events were controlled by medication or showed spontaneous regression, and no patients had discontinued EVR during the observation period (data not shown).
ALLOGRAFT FUNCTIONS AND INTERSTITIAL FIBROSIS:
The values of eGFR and FI from 3 months to 3 years after KTx are plotted in Figure 3. The mean eGFR at 3 months, and at 1 and 3 months after KTx were 53.4±16.2, 53.7±16.0, and 53.9±15.7 in the EVR+ group, and 54.0±18.3, 49.6±15.5, and 44.1±11.5 ml/min/1.73 m2 in the EVR− groups, respectively. eGFR in the EVR− group declined gradually, whereas that in that EVR+ group was maintained at almost the same level from 3 months to 3 years after KTx. The mean ΔGFR in EVR+ and EVR− groups were −0.27±6.8 and −9.8±13.0 ml/min/1.73 m2, respectively, indicating a significant difference between the 2 groups (P<0.001). Although the FI in both groups increased gradually from 3 months to 3 years after KTx, the ΔFI of the EVR− group showed a significantly higher increase than that of the EVR+ group (2.1±5.5% vs. 9.5±10.0%, P<0.001). Additionally, a negative correlation was observed between ΔGFR and ΔFI overall (R=−0.40, P<0.01, data not shown).
PATHOLOGICAL FINDINGS:
Mean scores by Banff classification at 3 months and 3 years in the EVR+ group were 0.80±0.54 and 0.68±0.60 for chronic tubular atrophy (ct), 0.067±0.25 and 1.1±0.64 for chronic interstitial fibrosis (ci), and 1.0±0.71 and 0.91±0.96 for hyaline arteriolar thickening (aah), and 0.16±0.37 and 0.06±0.26 for peritubular capillaritis (ptc), whereas those in the EVR− group were 0.85±0.67 and 0.57±0.66, 0.14±0.38 and 1.3±0.75, 1.1±0.81 and 0.38±0.62, and 0.18±0.40 and 0.10±0.31, respectively. No significant difference was observed between the changes in each score in the EVR+ and EVR− groups. Scores for chronic vascular fibrous intimal thickening (cv) and chronic allograft glomerulopathy (cg) were 0 in all patients at both 3 months and 3 years.
EXPRESSION OF MTOR-RELATED PROTEINS:
Positive staining of all 5 proteins (p-AKT, Rheb, p-mTOR, p-4EBP1, and p-p70S6K) was mainly observed in the cytoplasm of renal proximal and distal tubules, and slightly in glomeruli. Figure 4 shows typical images that were classified as score 0–3 for p-mTOR staining.
The mean staining score of each protein in both groups is presented in Figure 5. Although the expression of each protein at 3 months after KTx was at a similar level when comparing the EVR+ and EVR− groups, the staining score of p-mTOR was decreased significantly from 3 months to 3 years in the EVR+ group (P=0.028). Consequently, the staining score at 3 years after KTx was lower in the EVR+ group than in the EVR− group (P<0.01). The p-4EBP staining score at 3 years after KTx was also lower in the EVR+ group than in the EVR− group (P<0.01). For other proteins, the staining score did not show any specific changes from 3 months to 3 years after KTx, and the staining score at 3 years after KTx between EVR+ and EVR− groups also did not show any significant difference.
ALLOGRAFT FUNCTIONS AND INTERSTITIAL FIBROSIS STRATIFIED BY IMMUNOSUPPRESSIVE PROTOCOL AND DEGREE OF MTOR SIGNAL ENHANCEMENT:
To further explore the allograft functions and interstitial fibrosis, in view of the difference in immunosuppressive protocol and the correlation with the degree of mTOR signal enhancement, we performed the following subgroup analysis. We defined the mTOR signal score as the sum of the scores for p-mTOR and p-p70S6K, and p-4EBP staining, because they are the downstream of the mTOR signaling cascades and are thought to promote the cellular function when phosphorylated. We compared the change in ΔGFR and ΔFI among 4 groups classified as follows. Group 1: EVR + with mTOR signal score decreased from 3 months to 3 years (n=18), group 2: EVR+ with mTOR signal score increased from 3 months to 3 years (n=14), group 3: EVR− with mTOR signal score decreased from 3 months to 3 years (n=8). group 4: EVR− with mTOR signal score increased from 3 months to 3 years (n=20). In all patients, the mTOR signal scores at 3 months and at 3 years were 3.3±1.9 and 3.1±1.8, respectively. ΔGFR in groups 1, 2, 3, and 4 was −0.13±7.9, −0.45±6.6, −9.5±11, and −9.9±9.6, respectively, and ΔFI in groups 1, 2, 3, and 4 was 1.0±4.9, 3.4±5.0, 12.1±14.0, and 8.5±8.5, respectively (Figure 6). ΔGFR in groups 3 and 4 was significantly higher than that in groups 1 and 2 (P<0.01), but there was no significant difference between the ΔGFR in groups 1 and 2 or between ΔGFR in groups 3 and 4, respectively. In addition, we found that ΔFI in group 1 was significantly lower than in the other 3 groups (P<0.01).
RISK FACTORS FOR PROGRESSION OF INTERSTITIAL FIBROSIS:
We also explored predictors for the progression of fibrosis, i.e., ΔFI >10% by univariate and multivariate analyses, nominating the following clinical parameters: EVR early add-on (yes vs. no); recipient age (≤50 vs. >50 years); donor age (≤50 vs. >50 years); donor type (living-related vs. deceased); cold ischemic time (≤100 vs. >100 min), recipient BMI (≤25 vs. >25); pretransplant dialysis period (≤1000 vs. >1000 days); HLA mismatch (0–3 vs. 4–6), diabetes (− vs. +); systolic blood pressure (≤140 vs. >140 mmHg); low-density lipoprotein(LDL) cholesterol (≤140 vs. >140 mg/dl); triglyceride (TG) (≤150 vs. >150 mg/dl); eGFR at 3 months after KTx (≤60 vs. >60 ml/min/1.73 m2); Tac C0 at 1 year after KTx (≤5 vs. >5 ng/ml); Tac C0 at 3 years after KTx (≤5 vs. >5 ng/ml). Univariate analysis identified EVR early add-on, the pretransplant dialysis period, and Tac C0 at 1 year after KTx as significant predictors of fibrosis progression. Furthermore, based on the multivariate analysis, only EVR early add-on was independently associated with the progression of fibrosis (Table 2).
Discussion
Many randomized controlled trials (RCTs) show that adding mTOR-i to the immunosuppressive protocol and reducing or eliminating CNIs, especially at the early phase after KTx, lead to preserved excellent graft functions without compromising the rejection rate [3–5]. For example, the ZEUS study, which changed the CNI-based regimen to an EVR-based regimen at 4.5 months after KTx, showed significant improvement of GFR at 12 months [3]. The CENTRAL study also demonstrated a positive effect of changing from CyA to EVR at 7 weeks after transplantation on graft functions at 3 years [4]. SRL was used in place of CyA in the CONCEPT study and also significantly improved renal functions at 1 year [5]. Recently, the TRANSFORM study which randomized
As shown above, although the efficacy of EVR on kidney graft function remains controversial, most past studies successfully improved allograft function by EVR addition with CNI reduction/elimination. However, in these RCTs, little has been reported about the histological changes that may contribute to improvement of graft functions or the underlying molecular mechanisms.
Interstitial fibrosis is a morphological hallmark of chronic allograft dysfunction characterized by infiltration of mononuclear cells, fibroblast proliferation, and accumulation of extracellular matrix proteins in the peritubular interstitium [12,13]. The possible pathogeneses involved in establishment of interstitial fibrosis are wide-ranging, including ischemia-reperfusion injury, smoldering subclinical borderline rejection, hypertension, and chronic CNI-induced nephrotoxicity [14,15]. Some recent reports have successfully employed a technique to quantify the ratio of fibrotic components in the tissue of allograft biopsies using computer-assisted image analysis to evaluate the degree of interstitial fibrosis with much more accuracy and reproducibility [16,17]. The degree of interstitial fibrosis calculated by such methods correlates with the chronic interstitial fibrosis (ci) score determined by the Banff classification [18]. Furthermore, the degree of interstitial fibrosis calculated by the abovementioned technique is a good surrogate marker for deterioration of subsequent allograft functions [16]. Similarly, in our previous and present studies, the progression of interstitial fibrosis, determined by the semiquantitative method using computer analysis from 3 months to 3 years after KTx, showed a significant correlation with the decline in eGFR of the allograft, in contrast to the fact that Banff chronicity scores such as chronic tubular atrophy (ct) or chronic interstitial fibrosis (ci) did not show any significant correlation with allograft function [10].
mTOR exists as 2 complexes (mTORC1 and mTORC2) that regulate cellular functions such as proliferation, differentiation, metabolism, migration, and angiogenesis [6,7]. Growth factors and nutrients activate mTORC1 through Akt, which inactivates TSC1/TSC2, a heterodimer negatively regulating mTOR signaling by inhibiting Rheb, a small cytoplasmic GTPase and activator of mTORC1. Targets of mTORC1 include p70S6K and 4EBP-1, and their activation promotes protein synthesis for fibroblast proliferation and transition into active myofibroblasts, which enhance smooth muscle actin expression, collagen synthesis, and matrix accumulation, resulting in progression of interstitial fibrosis. It has become clear that the mTOR pathway has a crucial role in the development of kidney fibrosis in experimental animal models as well as the progression of interstitial fibrosis in human chronic kidney disease [9,19,20]. Based on these findings, we previously reported that p-mTOR and p-p70S6K expression at 3 months after KTx is an independent risk factor for subsequent progression of interstitial fibrosis using biopsy specimens obtained from human allografts [10].
Several basic studies have addressed the ability of mTOR-i to prevent the progression of interstitial fibrosis in various kidney diseases [21–23]. For example, Chen et al. reported that, in the unilateral obstruction nephropathy mouse model, rapamycin suppresses the immunoreactivity of mTOR signaling in interstitial macrophages and myofibroblasts, which contributes to ameliorating fibrotic progression [21].
Based on the findings in these reports, we hypothesized that the anti-fibrotic effect of EVR via regulation of mTOR-related proteins may improve allograft functions after KTx. We used human biopsy specimens obtained at 3 months and 3 years after KTx and examined the effects of EVR on suppression of allograft fibrosis and consequent improvement of allograft functions, as well as mTOR-related protein expression. First, the main finding of our analysis was that early administration of EVR and reducing Tac exposure contributed to avoiding GFR degradation after KTx, which was consistent with other clinical trials. Furthermore, we revealed that such treatment contributed to preventing the kidney graft from progression to interstitial fibrosis. Taken together, these results may account for the possible pathological mechanism of EVR with Tac reduction affecting allograft functions through amelioration of interstitial fibrosis. Second, we examined the influence of early EVR addition and Tac reduction on the expression of mTOR-related proteins and found that p-mTOR and p-4EBP1 expression at 3 years in the EVR+ group was significantly lower than that in the EVR− group. Whether it was the direct medical efficacy of everolimus or the by-product of reduced tacrolimus, these results suggested that our EVR early add-on protocol attenuated the functions of the mTOR signaling pathway. To further explore the allograft functions and interstitial fibrosis in association with both the EVR early add-on protocol and the degree of mTOR signal enhancement, we performed a subgroup analysis and found that the degree of fibrosis progression was significantly higher in patients in the EVR early add-on protocol with mTOR signaling decrease. On the basis of these findings, we speculate that the mTOR signaling was suppressed by the EVR early add-on protocol, which consequently mitigated the progression of fibrosis.
Finally, we investigated the risk factors for the development of interstitial fibrosis. In the multivariate analysis, early EVR addition was an independent predictor for subsequent allograft fibrosis, whereas the Tac C0 concentration at neither 1 nor 3 years proved to be a risk factor. Together with the result that the extent of hyaline arteriolar thickening, the typical pathological feature of chronic Tac nephrotoxicity, also did not differ between the EVR+ (reduced Tac) and EVR− (normal Tac) groups, these findings suggest the possibility that our EVR addition with the Tac reduction protocol suppresses allograft fibrosis progression, likely by the EVR addition rather than the decrease in Tac exposure.
Several clinical studies that have indicated the anti-fibrotic effect of mTOR-i and explored the underlying molecular mechanisms [24–26]. Becker et al. revealed that the extent of fibrosis in the biopsy specimens of the patients who were transferred from CNI to mTOR-i (EVR or SRL) was lower than that of patients who continued CNI [24]. Additionally, they showed that TGF-β expression in the tubulointerstitium was decreased in the mTOR-i group, but not in the CNI group. Similar findings by Pontrelli et al. showed that changing CNI to SRL inhibits plasminogen activator inhibitor-1 and reduces interstitial fibrosis in patients who have already presented with chronic allograft nephropathy after KTx [25]. The findings in the present study supported these reports, that is, the addition of mTOR-i concomitant with CNI elimination or reduction possibly ameliorate allograft functions through suppression of interstitial fibrosis progression. Furthermore, the results of our study may offer insight into the mechanism underlying the suppression of allograft fibrosis via the regulation of mTOR-related proteins in patients who were treated with early EVR add-on and CNI minimization.
There are some concerns about the results of this study, especially the discrepancy between upregulation of p-mTOR and p-4EBP, and other mTOR-related proteins. Jiang et al. reported that p70S6K expression was proportional to mTOR expression in fibroblasts stimulated by TGF-β, whereas 4EBP1 expression was not [20]. In contrast, Sun et al. suggested that 4EBP1 rather than p-S6 (a ribosomal protein phosphorylated by p70S6K) was responsible for controlling the cell cycle and proliferation of tubular epithelial cells, resulting in progression of interstitial fibrosis [22]. Thus, which protein in the mTOR pathway plays a more important role in interstitial fibrosis remains controversial.
Several limitations should be considered when interpreting the results of this study. First, this study is a retrospective analysis of a relatively small number of patients with a short observation period. Three years of follow-up may be insufficient to evaluate long-term outcomes of our protocol of early EVR addition with Tac reduction. Second, the patients recruited in this study were not prospectively randomized to each group, but rather were allocated depending on their historical background. However, because of the relatively short whole recruiting period (10 years), the treatment strategy including the immunosuppressive protocol except for CNI and EVR did not practically change throughout the observation period. Third, neither inulin nor creatinine clearance, but only eGFR, was used to evaluate the changes in graft functions, because 24-hour urine samples were not available for these cohorts. Fourth, because the immunohistochemical staining was assessed semiquantitatively, the staining scores may not consistently reflect the exact degree of the expression of each mTOR-related protein. Fifth, because the immunosuppressive protocol in the EVR+ group added EVR and concomitantly reduced Tac, it is possible that the suppression of mTOR-related proteins, allograft fibrosis, and the improvement of allograft function are, in part, attributable to Tac reduction. To minimize the influence of changes in Tac exposure on our findings, we reduced rather than excluded Tac in the EVR+ group and proved that the Tac C0 concentration at 1 and 3 years did not affect allograft fibrosis using multivariate analysis. Although these results do not completely explain the direct anti-fibrotic effect of EVR, the EVR-based immunosuppressive protocol with Tac reduction in this study comprehensively suppressed mTOR-related proteins, leading to improved allograft function.
Conclusions
In conclusion, our study suggests that EVR addition and Tac reduction attenuated kidney allograft fibrosis. Although the exact mechanism should be further investigated, our results suggested that the regulation of the mTOR signaling process may be involved in the suppression of allograft fibrosis progression using this immunosuppressive regimen. Although maintaining balance is of the greatest importance in choosing and adjusting the immunosuppressive drugs, these results may have provided us with the indication for the use of EVR in the treatment of patients with KTx.
Figures
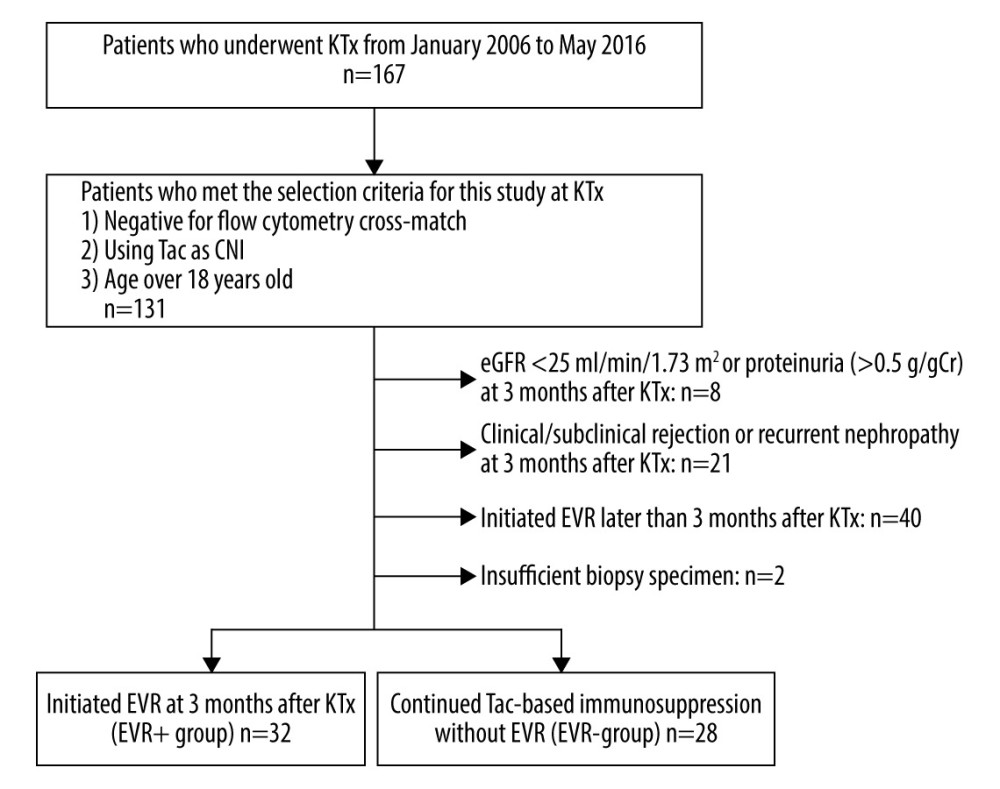 Figure 1. Flow chart of the patient selection process. KTx – kidney transplantation; Tac – tacrolimus; CNI – calcineurin inhibitor; eGFR – estimated-glomerular filtration rate (ml/min/1.73 m2); AR – acute rejection; EVR – everolimus.
 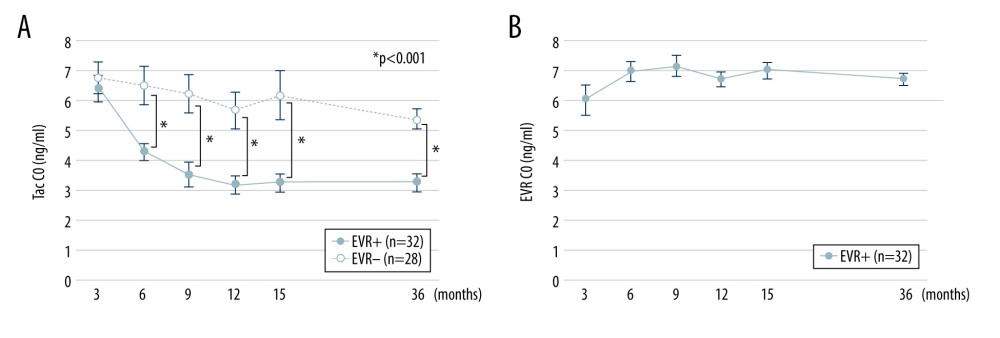 Figure 2. Trough concentrations of Tac and EVR in the EVR+ and EVR− groups. (A) The trough concentration of Tac in the EVR+ group ( – closed circles) was significantly lower than in the EVR− group ( – open circles) at 6, 9, 12, 15 months, and 3 years after kidney transplantation (* P<0.001). (B) The trough concentration of EVR was in the range of 5–8 ng/ml at all times. C0 – trough concentration; Tac – tacrolimus; EVR – everolimus.
 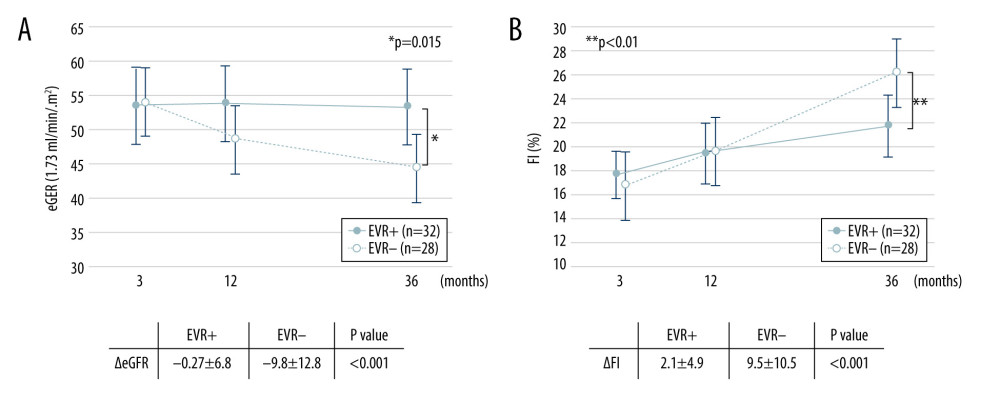 Figure 3. Change in eGFR and FI after kidney transplantation in the EVR+ and EVR− groups. (A) eGFR values in the EVR+ group ( – closed circles) and EVR− group ( – open circles) from 3 months to 3 years after KTx. Declines in eGFR from 3 months to 3 years after KTx (ΔeGFR=eGFR at 3 years–eGFR at 3 months) in the EVR+ group were significantly less than those in the EVR− group (P<0.001). (B) The extent of fibrosis (FI) in the EVR+ group ( – closed circles) and EVR− group ( – open circles) from 3 months to 3 years after KTx. The progression of fibrosis (ΔFI=FI at 3 years–FI at 3 months) in the EVR− group was significantly greater than in the EVR+ group (P<0.001). eGFR – estimated-glomerular filtration rate (ml/min/1.73 m2); FI – fibrosis index (%), KTx – kidney transplantation; EVR – everolimus.
 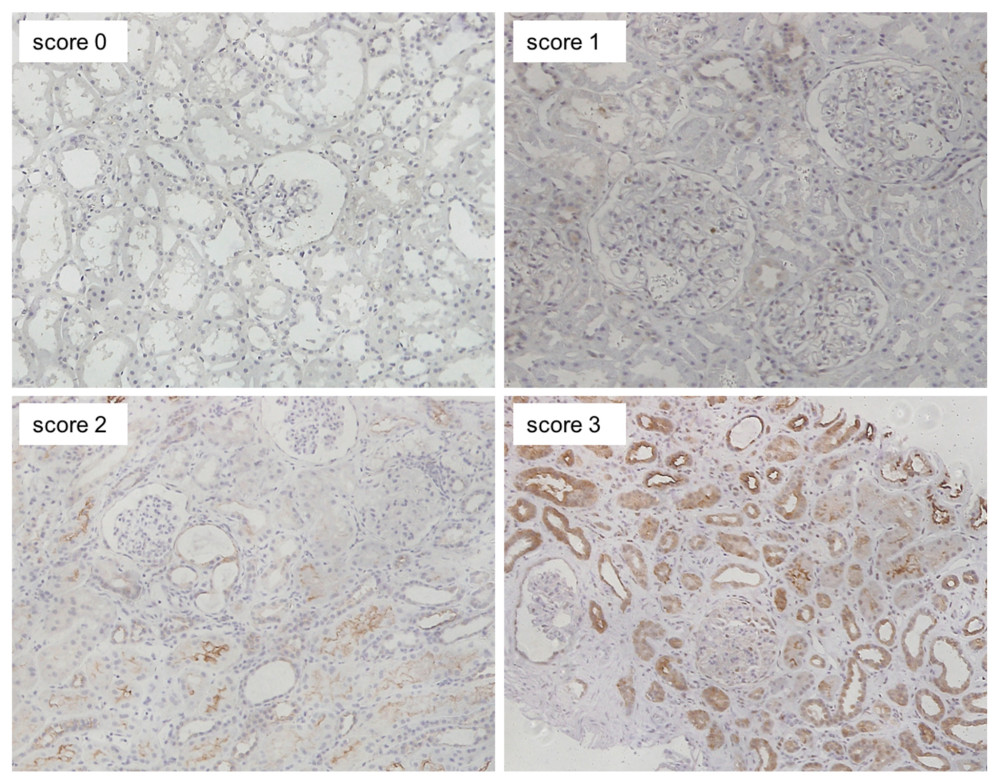 Figure 4. Representative images of immunohistochemical staining (scores 0–3 of p-mTOR staining). Positive staining was mainly observed in the cytoplasm of renal proximal and distal tubules, and slightly in glomeruli (magnification: ×200). p-mTOR – phosphorylated mammalian target of rapamycin.
 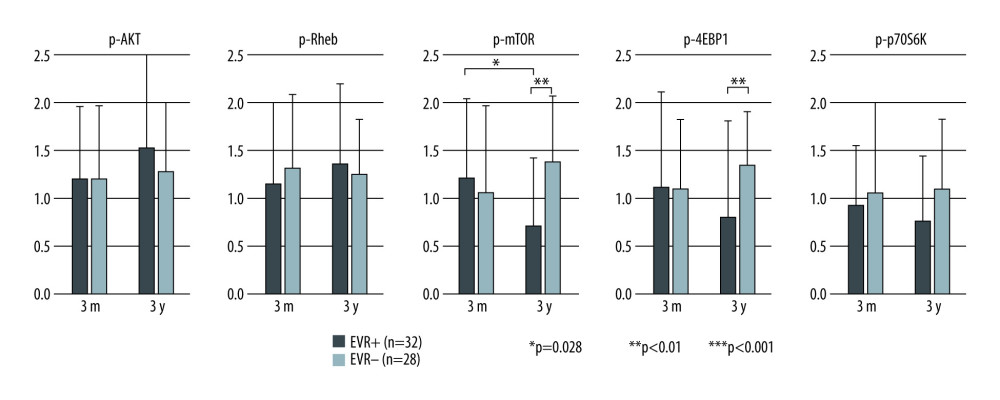 Figure 5. Mean staining score of each protein at 3 months and 3 years after KTx in the EVR+ and EVR− groups. The staining scores of all 5 proteins at 3 months after KTx were similar in EVR+ () and EVR− () groups. The p-mTOR staining score in the EVR+ group was significantly decreased from 3 months to 3 years after KTx (* P=0.028). For p-mTOR and p-4EBP, the staining scores at 3 years after KTx were higher in the EVR− group than in the EVR+ group (** P<0.01, *** P<0.01, respectively). 3m – 3 months after kidney transplantation; 3y – 3 years after kidney transplantation; p-Akt – phosphorylated Akt; Rheb – Ras homolog enriched in brain; p-mTOR – phosphorylated mammalian target of rapamycin; p-p70S6K – phosphorylated p70 ribosomal S6 kinase; p-4EBP1 – phosphorylated 4E-binding protein 1.
 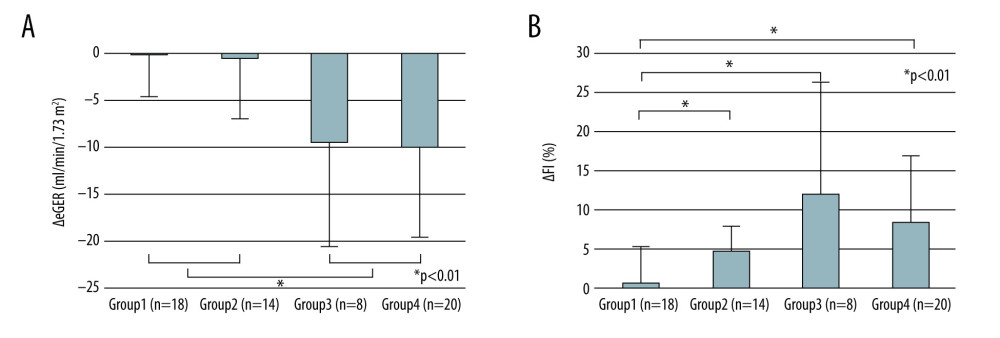 Figure 6. Change in eGFR and FI after kidney transplantation stratified by immunosuppressive protocol and degree of mTOR signal enhancement. The mTOR signal score is defined as the sum of the score in phosphorylated mTOR and phosphorylated p70S6K, and phosphorylated 4EBP staining. Group 1: EVR+ with mTOR signal score decreased from 3 months to 3 years (n=18); group 2: EVR+ with mTOR signaling score increased from 3 months to 3 years (n=14); group 3: EVR− with mTOR signaling score decreased from 3 months to 3 years (n=8); group 4: EVR− with mTOR signaling score increased from 3 months to 3 years (n=20). (A) Decreases in eGFR from 3 months to 3 years after KTx (ΔeGFR=eGFR at 3 years–eGFR at 3 months) in the groups 1 and 2 (EVR+ with mTOR signal score decrease or increase) were significantly lower than those in groups 3 and 4 (EVR− with mTOR signal score decrease or increase) (P<0.01). (B) The progression of fibrosis (ΔFI=FI at 3 years–FI at 3 months) in group 1 (EVR+ with mTOR signal score decrease) was significantly milder than in the other 3 groups (P<0.001). mTOR – mammalian target of rapamycin; eGFR – estimated-glomerular filtration rate (ml/min/1.73 m2); FI – fibrosis index (%); KTx – kidney transplantation; EVR – everolimus.
 References
1. Ekberg H, Tedesco-Silva H, Demirbas A, Reduced exposure to calcineurin inhibitors in renal transplantation: N Engl J Med, 2007; 357(25); 2562-75
2. Boor P, Floege J, Renal allograft fibrosis: biology and therapeutic targets: Am J Transplant, 2015; 15(4); 863-86
3. Budde K, Becker T, Arns W: Lancet, 2011; 377(9768); 837-47
4. Mjornstedt L, Schwartz Sorensen S, von Zur Muhlen B, Renal function three years after early conversion from a calcineurin inhibitor to everolimus: Results from a randomized trial in kidney transplantation: Transpl Int, 2015; 28(1); 42-51
5. Lebranchu Y, Thierry A, Toupance O, Efficacy on renal function of early conversion from cyclosporine to sirolimus 3 months after renal transplantation: Concept study: Am J Transplant, 2009; 9(5); 1115-23
6. Wullschleger S, Loewith R, Hall MN, TOR signaling in growth and metabolism: Cell, 2006; 124(3); 471-84
7. Fingar DC, Blenis J, Target of rapamycin (TOR): An integrator of nutrient and growth factor signals and coordinator of cell growth and cell cycle progression: Oncogene, 2004; 23(18); 3151-71
8. Lieberthal W, Levine JS, The role of the mammalian target of rapamycin(mTOR) in renal disease: J Am Soc Nephrol, 2009; 20; 2493-502
9. Kajiwara M, Masuda S, Role of mTOR inhibitors in kidney disease: Int J Mol Sci, 2016; 17(6); 975
10. Ogawa S, Ishimura T, Miyake H, Fujisawa M, Expression profile of mammalian target of rapamycin-related proteins in graft biopsy specimens: Significance for predicting interstitial fibrosis after kidney transplantation: Int J Urol, 2017; 24(3); 223-29
11. Ishimura T, Fujisawa M, Isotani S, Transforming growth factor-β1 expression in early biopsy specimen predicts long-term graft function following pediatric renal transplantation: Clin Transplant, 2001; 15(3); 185-91
12. Nankivell BJ, Borrows RJ, Fung CL, The natural history of chronic allograft nephropathy: N Engl J Med, 2003; 349(24); 2326-33
13. Campistol JM, Boletis IN, Dantal J, Chronic allograft nephropathy – a clinical syndrome: Early detection and the potential role of proliferation signal inhibitors: Clin Transplant, 2009; 23(6); 769-77
14. Cosio FG, Grande JP, Larson TS, Kidney allograft fibrosis and atrophy early after living donor transplantation: Am J Transplant, 2005; 5(5); 1130-36
15. Soles K, Colvin RB, Racusen LC, Banff ’05 meeting report: Differential diagnosis of chronic allograft injury and elimination of chronic allograft nephropathy (‘CAN’): Am J Transplant, 2007; 7(3); 518-26
16. Pape L, Henne T, Offner G, Computer-assisted quantification of fibrosis in chronic allograft nephropathy by picosirius red-staining: A new tool for predicting long-term graft function: Transplantation, 2003; 76(6); 955-58
17. Meas-Yedid V, Servais A, Noël LH, New computerized color image analysis for the quantification of interstitial fibrosis in renal transplantation: Transplantation, 2011; 92(8); 890-99
18. Farris AB, Adams CD, Brousaides N, Morphometric and visual evaluation of fibrosis in renal biopsies: J Am Soc Nephrol, 2011; 22(1); 176-86
19. Wang S, Wilkes MC, Leof EB, Hirschberg R, Noncanonical TGF-pathways, mTORC1 and Abl, in renal interstitial fibrogenesis: Am J Physiol Renal Physiol, 2010; 298(1); F142-49
20. Jiang L, Xu L, Mao J, Rheb/mTORC1 signaling promotes kidney fibroblast activation and fibrosis: J Am Soc Nephrol, 2013; 24(7); 1114-26
21. Chen G, Chen H, Wang C, Rapamycin ameliorates kidney fibrosis by inhibiting the activation of mTOR signaling in interstitial macrophages and myofibroblasts: PLoS One, 2012; 7(3); e33626
22. Sun X, Wei W, Ren J, Inhibition of 4E-BP1 phosphorylation promotes tubular cell escaping from G2/M arrest and ameliorates kidney fibrosis: Cell Signal, 2019; 62; 109331
23. Wu MJ, Wen MC, Chiu YT, Rapamycin attenuates unilateral ureteral obstruction-induced renal fibrosis: Kidney Int, 2006; 69(11); 2029-36
24. Becker LE, Weritz B, Yi X, Evolution of allograft fibrosis and function in kidney transplant recipients: A retrospective analysis of stable patients under CNI and mTORi: Transpl Int, 2015; 28(5); 533-64
25. Pontrelli P, Rossini M, Infante B, Rapamycin inhibits PAI-1 expression and reduces interstitial fibrosis and glomerulosclerosis in chronic allograft nephropathy: Transplantation, 2008; 85(1); 125-34
26. Ruiz JC, Campistol JM, Grinyó JM, Early cyclosporine A withdrawal in kidney transplant recipients receiving sirolimus prevents progression of chronic pathologic allograft lesions: Transplantation, 2004; 78(9); 1312-18
Figures
Figure 1. Flow chart of the patient selection process. KTx – kidney transplantation; Tac – tacrolimus; CNI – calcineurin inhibitor; eGFR – estimated-glomerular filtration rate (ml/min/1.73 m2); AR – acute rejection; EVR – everolimus.Figure 2. Trough concentrations of Tac and EVR in the EVR+ and EVR− groups. (A) The trough concentration of Tac in the EVR+ group ( – closed circles) was significantly lower than in the EVR− group ( – open circles) at 6, 9, 12, 15 months, and 3 years after kidney transplantation (* P<0.001). (B) The trough concentration of EVR was in the range of 5–8 ng/ml at all times. C0 – trough concentration; Tac – tacrolimus; EVR – everolimus.Figure 3. Change in eGFR and FI after kidney transplantation in the EVR+ and EVR− groups. (A) eGFR values in the EVR+ group ( – closed circles) and EVR− group ( – open circles) from 3 months to 3 years after KTx. Declines in eGFR from 3 months to 3 years after KTx (ΔeGFR=eGFR at 3 years–eGFR at 3 months) in the EVR+ group were significantly less than those in the EVR− group (P<0.001). (B) The extent of fibrosis (FI) in the EVR+ group ( – closed circles) and EVR− group ( – open circles) from 3 months to 3 years after KTx. The progression of fibrosis (ΔFI=FI at 3 years–FI at 3 months) in the EVR− group was significantly greater than in the EVR+ group (P<0.001). eGFR – estimated-glomerular filtration rate (ml/min/1.73 m2); FI – fibrosis index (%), KTx – kidney transplantation; EVR – everolimus.Figure 4. Representative images of immunohistochemical staining (scores 0–3 of p-mTOR staining). Positive staining was mainly observed in the cytoplasm of renal proximal and distal tubules, and slightly in glomeruli (magnification: ×200). p-mTOR – phosphorylated mammalian target of rapamycin.Figure 5. Mean staining score of each protein at 3 months and 3 years after KTx in the EVR+ and EVR− groups. The staining scores of all 5 proteins at 3 months after KTx were similar in EVR+ () and EVR− () groups. The p-mTOR staining score in the EVR+ group was significantly decreased from 3 months to 3 years after KTx (* P=0.028). For p-mTOR and p-4EBP, the staining scores at 3 years after KTx were higher in the EVR− group than in the EVR+ group (** P<0.01, *** P<0.01, respectively). 3m – 3 months after kidney transplantation; 3y – 3 years after kidney transplantation; p-Akt – phosphorylated Akt; Rheb – Ras homolog enriched in brain; p-mTOR – phosphorylated mammalian target of rapamycin; p-p70S6K – phosphorylated p70 ribosomal S6 kinase; p-4EBP1 – phosphorylated 4E-binding protein 1.Figure 6. Change in eGFR and FI after kidney transplantation stratified by immunosuppressive protocol and degree of mTOR signal enhancement. The mTOR signal score is defined as the sum of the score in phosphorylated mTOR and phosphorylated p70S6K, and phosphorylated 4EBP staining. Group 1: EVR+ with mTOR signal score decreased from 3 months to 3 years (n=18); group 2: EVR+ with mTOR signaling score increased from 3 months to 3 years (n=14); group 3: EVR− with mTOR signaling score decreased from 3 months to 3 years (n=8); group 4: EVR− with mTOR signaling score increased from 3 months to 3 years (n=20). (A) Decreases in eGFR from 3 months to 3 years after KTx (ΔeGFR=eGFR at 3 years–eGFR at 3 months) in the groups 1 and 2 (EVR+ with mTOR signal score decrease or increase) were significantly lower than those in groups 3 and 4 (EVR− with mTOR signal score decrease or increase) (P<0.01). (B) The progression of fibrosis (ΔFI=FI at 3 years–FI at 3 months) in group 1 (EVR+ with mTOR signal score decrease) was significantly milder than in the other 3 groups (P<0.001). mTOR – mammalian target of rapamycin; eGFR – estimated-glomerular filtration rate (ml/min/1.73 m2); FI – fibrosis index (%); KTx – kidney transplantation; EVR – everolimus. Tables
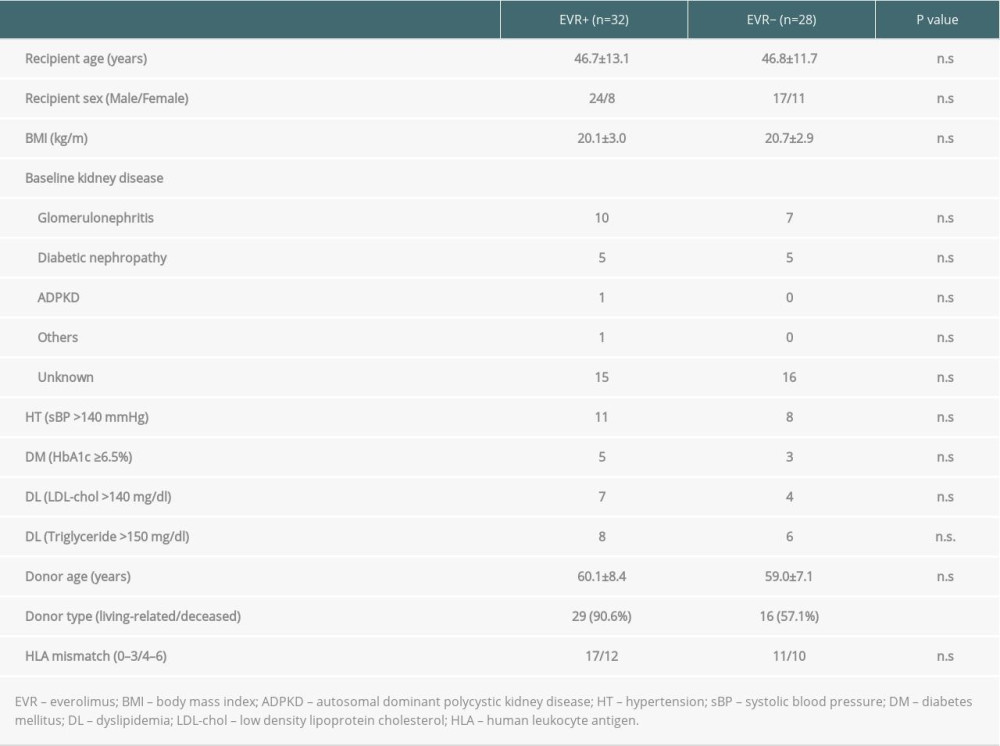 Table 1. Baseline characteristics of the patients in EVR+ and EVR− group.
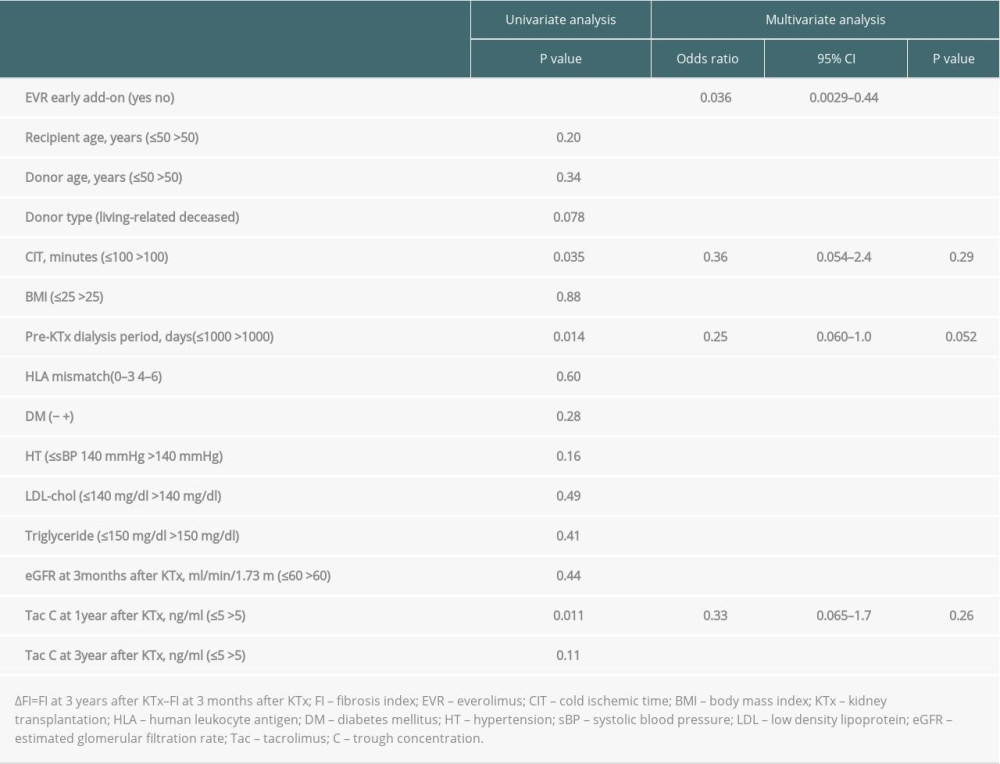 Table 2. Univariate and multivariate analysis of the parameters predicting the progression of the graft fibrosis (ΔFI >10%).Table 1. Baseline characteristics of the patients in EVR+ and EVR− group.Table 2. Univariate and multivariate analysis of the parameters predicting the progression of the graft fibrosis (ΔFI >10%).
 In Press
Original article
The Anatomical Landscape of Living Donor Livers: A 101-Case Retrospective Single-Center Study in Indonesia ...Ann Transplant In Press; DOI: 10.12659/AOT.952031
Original article
Decreased Ventilation Duration and ICU Stay Associated With Early Percutaneous Dilatational Tracheostomy Af...Ann Transplant In Press; DOI: 10.12659/AOT.953143
Original article
Immunosuppression Withdrawal in Pediatric Liver Transplant Recipients With Posttransplant Lymphoproliferati...Ann Transplant In Press; DOI: 10.12659/AOT.952021
Original article
Common Versus External Iliac Arterial Anastomosis in Kidney Transplantation: A Bicentric Retrospective Anal...Ann Transplant In Press; DOI: 10.12659/AOT.953269
Most Viewed Current Articles
24 Aug 2021 : Review article 20,864
Normothermic Machine Perfusion (NMP) of the Liver – Current Status and Future PerspectivesDOI :10.12659/AOT.931664
Ann Transplant 2021; 26:e931664
29 Dec 2021 : Original article 17,029
Efficacy and Safety of Tacrolimus-Based Maintenance Regimens in De Novo Kidney Transplant Recipients: A Sys...DOI :10.12659/AOT.933588
Ann Transplant 2021; 26:e933588
05 Apr 2022 : Original article 16,094
Impact of Statins on Hepatocellular Carcinoma Recurrence After Living-Donor Liver TransplantationDOI :10.12659/AOT.935604
Ann Transplant 2022; 27:e935604
22 Nov 2022 : Original article 16,067
Long-Term Effects of Everolimus-Facilitated Tacrolimus Reduction in Living-Donor Liver Transplant Recipient...DOI :10.12659/AOT.937988
Ann Transplant 2022; 27:e937988